Boston's More Diverse Than You May Realize
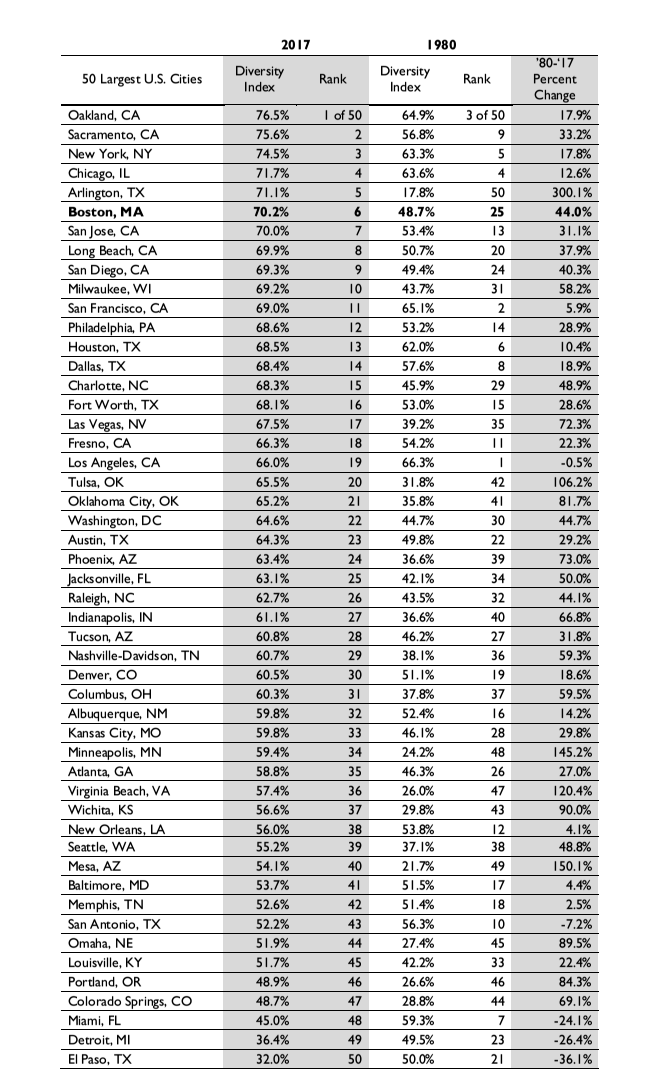
Diversity is core to what makes cities great. In the ideal, people of different backgrounds and perspectives live side by side, creating new businesses, solving big problems and enjoying one another’s cultures and traditions. Among major American cities, Boston has long had the reputation of being a White city. But this has changed rapidly in recent years. Boston is now the sixth most diverse U.S. city, according to new Census data released this month.
People often use diverse as synonymous with non-white, but that’s not what it means. Diversity means having a mix of different people represented across multiple groups—this is why a single person can’t be “diverse.” For example, San Antonio has a large non-white population, but isn’t especially diverse. San Antonio is 75 percent non-white, and 64 percent of the city is Hispanic or Latino (there is, however, lots of diversity by national origin within the broad category of Hispanic or Latino). Boston, on the other hand, has a strong mix of people from several different racial/ethnic backgrounds.
Having racial diversity, however, is far from enough to guarantee that opportunity is equal and that people are treated without prejudice. Both Boston and Oakland (the most diverse U.S. city, which we discuss later) continue to wrestle with long histories of racial discrimination. Having citywide diversity doesn’t even ensure that people actually interact with others who are different from them. Many Boston neighborhoods are segregated by race and income. Even within our more integrated neighborhoods, the schools and classrooms our kids attend are often quite segregated. But our increasing diversity provides us greater strength in overcoming these challenges.
The comparison of racial diversity across cities can be tough to wrap one’s head around because it involves looking across multiple categories at once. Fortunately, the “diversity index,” which we calculate for this brief, helps facilitate clear comparisons. The diversity index factors in a population’s demographics across all subgroups and then calculates the probability that two people chosen randomly will be different from each other. One practical way to use the diversity index would be asking something like: What are the chances that a person standing next to me on a random street corner will be of a different race?
For detail on Boston, or any other large U.S. city, see the interactive tool below.
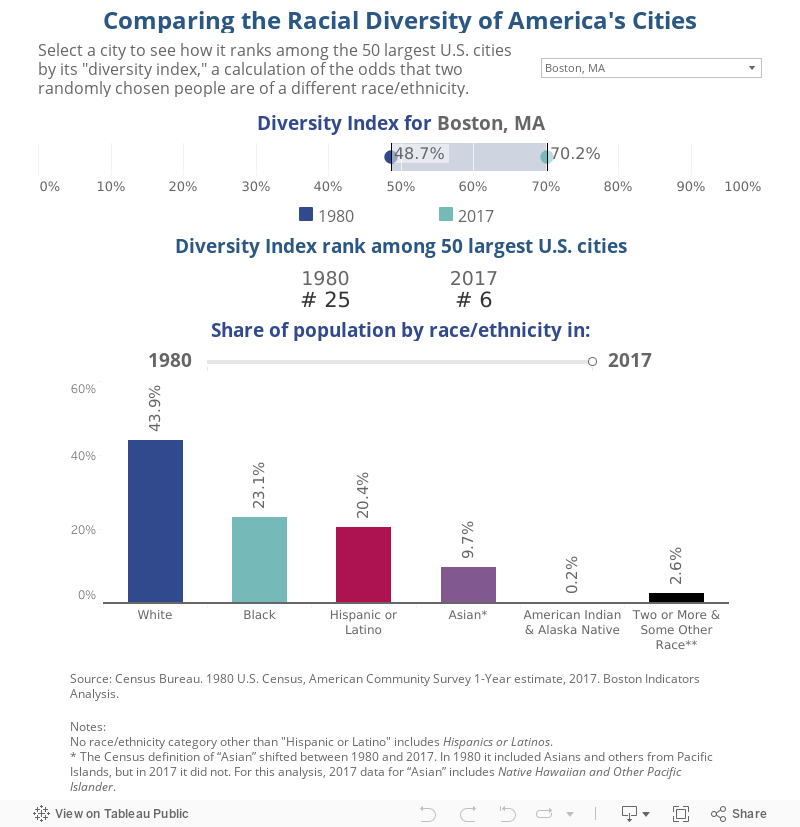
For Boston in 2017, there was a 70 percent chance that two people chosen at random would be of different races. White people still make up our single largest racial group, at 44 percent, but our higher diversity index reflects the fact that we now have a stronger mix across other races. Driven in part by the arrival of new immigrants, our Latino and Asian populations have grown significantly since 1980—from 6 to 20 percent and from 3 to 10 percent, respectively. People of two or more races (non-Hispanic) are currently 1.9 percent of the city (4.1 percent if including both Hispanic and non-Hispanic). The Census did not allow people to select two or more races prior to 2000. (For detail on adjustments we’ve made in order to account for shifting Census race/ethnicity definitions, see the note in the interactive tool above.) Our Black population has been relatively level, growing modestly from 22 to 23 percent. Our American Indian population has also remained level, at 0.2 percent of the city in 1980 and 2017.
While predominantly White for most of the 20th century, Boston still had some diversity in this earlier era. Boston had modestly-sized Black, Asian and Latino neighborhoods, and there was ethnic diversity within the White population (e.g., people of Irish, Italian, Eastern European descent). But the sizes of non-White racial groups were smaller than they are today.
Racial diversity increased nationwide since 1980, and Boston diversified even faster. The average diversity index among the 50 largest U.S. cities in 1980 was 45.7 percent, and it increased to 61.4 percent in 2017 (a nearly 15.7 percentage point increase). Over the same period, Boston’s diversity index increased from 48.7 percent in 1980 to 70.2 percent in 2017 (a 21.5 percentage point increase).
The most diverse city in America is Oakland, California, where there’s a 77 percent chance that two people chosen at random would be of different races. Remarkably, each of the four largest racial/ethnic categories in Oakland represent between 15 and 30 percent of the city: 28 percent of the city is Hispanic or Latino, 27 percent is White, 23 percent is Black, and 16 percent is Asian. That’s a remarkably balanced mix across groups.
Increased diversity does not automatically lead to better outcomes in our communities. Change can be hard, and people from dominant groups may have especially emotional reactions. It takes concerted effort by all residents to learn about each other and to ensure that newcomers and established populations are integrated with mutual respect and that our civic institutions evolve appropriately over time.