The Good, the Bad, and the Meh: 10 Trends of the 2010s
By Trevor Mattos
December 20, 2019
This is an online version of our Boston Research Snapshot email newsletter from December, 2019. Sign up to get the newsletter in your inbox every month.
Each December we use our newsletter to highlight indicators of change from the year. But because this December also caps a decade, we’re instead reflecting on longer 10-year(ish) trends. The 2010s coincided with the slow, but steady, economic recovery following the Great Recession, so some economic indicators are pretty positive. Nonetheless, many challenges continued or worsened: Wage growth has been negative for all categories of workers with less than a college degree, our transportation system is in crisis, and many Greater Boston suburbs continue to contribute very little toward our regional housing needs. Let’s make the 2020’s a decade of real progress on these issues!
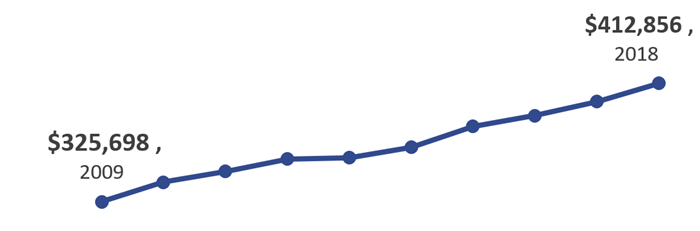
- In the aggregate, Greater Boston’s economy has grown significantly over the last decade, with real GDP up nearly 30 percent.
Gross Domestic Product, in billions of inflation adjusted dollars, Greater Boston
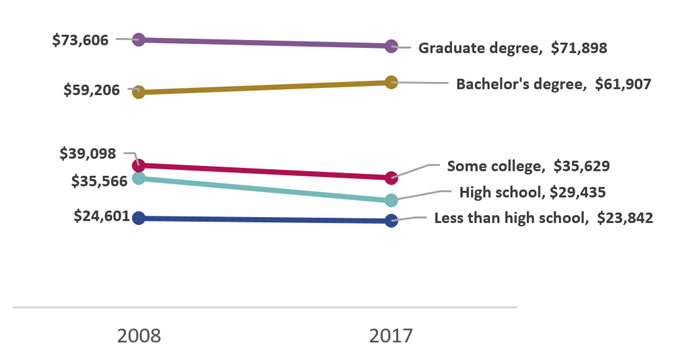
- Even though our economy has grown significantly, the benefits of this growth have not been broadly shared. Over the decade, only Bostonians with a college degree saw meaningful wage growth; others, especially those with lower levels of education, saw steep declines in real wages. This mostly matches the national trend of a growing economy not benefiting workers across the income spectrum.
Annual earnings for population ages 25+ by educational attainment, adjusted for inflation, Boston
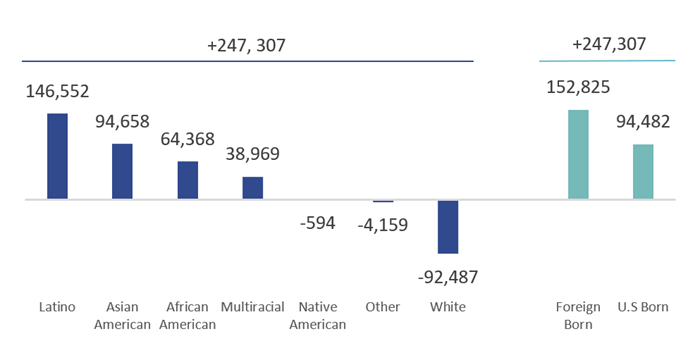
- Greater Boston’s multi-decade resurgence continued during the 2010s, with the region's population growing by nearly 250,000. This growth has been driven by communities of color and more than half of this net growth has come from immigrants born outside of the US. Our Changing Faces of Greater Boston report has more detail on these trends back to 1990.
Net population change, 2009-2017, Greater Boston
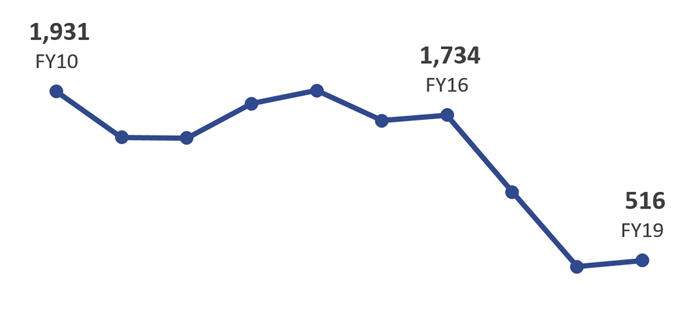
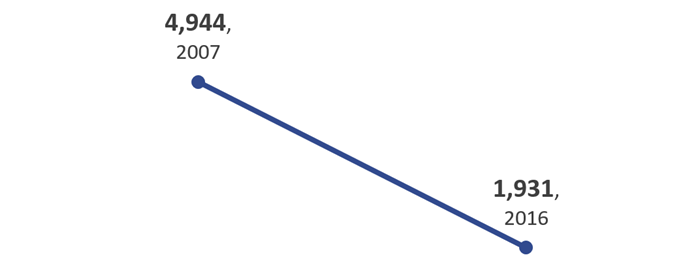
- Even though the number of refugees has grown to roughly 20 million worldwide, the Trump Administration has dramatically lowered the number of refugees admitted into the U.S. (see our recent immigration policy report for more detail). This has caused the number of refugees welcomed into Massachusetts to plummet 70 percent in just three years.
Refugee admissions, Massachusetts
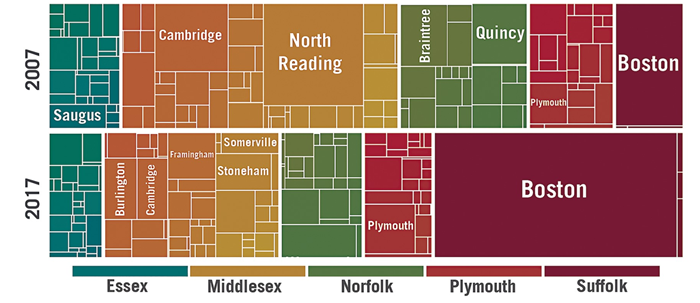
- As Greater Boston home prices shot up nearly 72 percent during the 2010s, the City of Boston redoubled efforts to permit new construction, tripling its share of building permits. One big challenge, however, is that many suburbs aren’t contributing nearly as much toward meeting our regional housing needs.
Share of total annual housing permits issued by municipality and county, Greater Boston
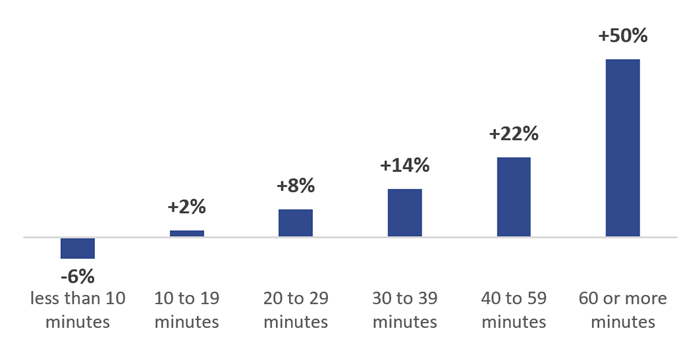
- Our regional transportation system entered a state of crisis over the past decade, resulting in the worst traffic in the country, according to one study. Commute times are up for road and public transit commuters alike, with the number of 60+ minute commutes up 50 percent from 2007 to 2017. This data likely understates the full toll of our transportation challenges by not accounting for people who choose not to pursue work opportunities far from home or those who shift their schedules to more inconvenient times in order to avoid congestion.
Change in number of people within each commute time category, 2007-2017, Greater Boston
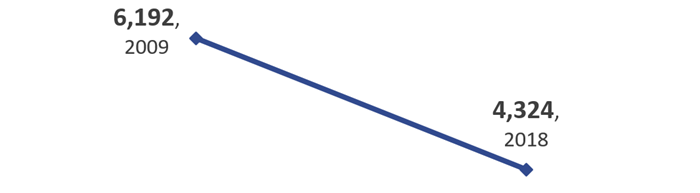
- Violent crime continued its steady decline through the 2010s, falling 30 percent since 2009. This is a long-run trend common across many major US cities.
Violent Crime Incidents, Boston
- Due in part to greater access to long-lasting, reversible forms of birth control (like IUDs), teen births statewide are down 60 percent. This reflects a decades-long decline in teen pregnancies across the U.S.
Teen births for population ages 15-19, Massachusetts
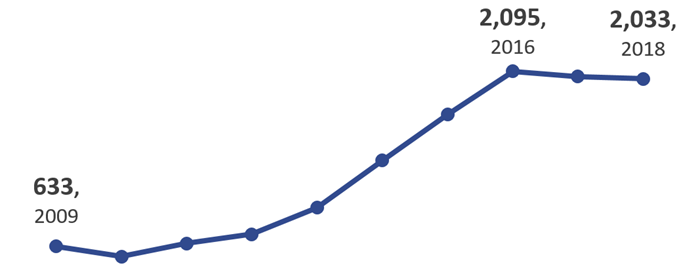
- Opioid-related deaths in Massachusetts more than tripled over the past decade. Today, Massachusetts has an opioid-related death rate roughly twice the national average. Local efforts to address the epidemic have led to some modest progress since 2016.
Opioid-related deaths, Massachusetts
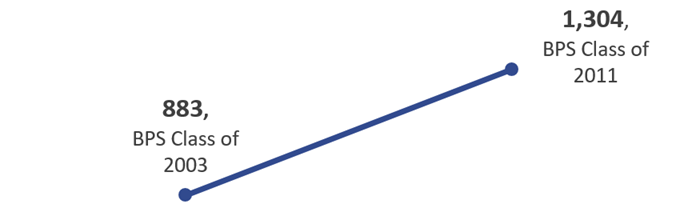
- The number of Boston Public Schools graduates completing college within six years increased almost 50 percent over the past decade, thanks in no small part to the coaching and mentorship many students receive through Success Boston.
Boston Public Schools graduates completing college within six years