Poverty in Massachusetts Higher Than 24 Other States
By Luc Schuster and Peter Ciurczak
September 11, 2019
This is an online version of our Boston Research Snapshot email newsletter from March, 2019. Sign up to get the newsletter in your inbox every month.
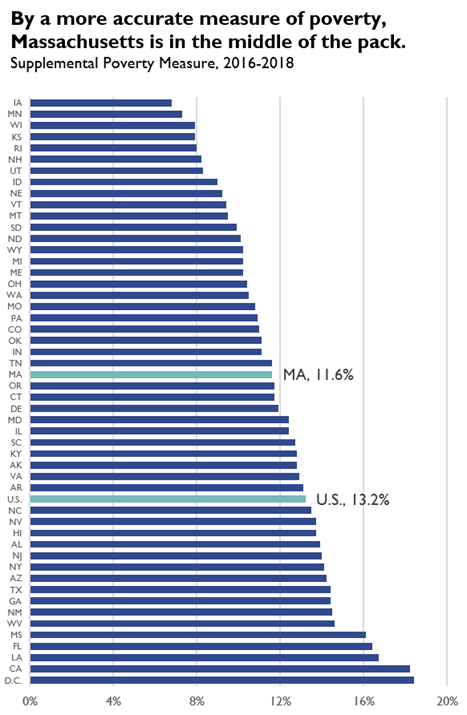
Massachusetts is one of the richest states in the country, so we ought to be able to provide everyone a basic standard of living. And yet Massachusetts has a poverty rate higher than 24 other states, according to new data released yesterday from the U.S. Census Bureau.
Most coverage of poverty focuses on the “official” measure, but this measure is widely understood to be very crude. In short, it’s an inflation-adjusted calculation of three times the cost of a minimum food budget in 1955. Earn less than that and you’re officially poor. Recognizing the many limitations of this approach, the U.S. Census Bureau in 2011 developed a more nuanced alternative called the Supplemental Poverty Measure (SPM), and it now tracks both measures side by side. Yesterday the Census Bureau released new estimates for the 2016–2018 time period, showing that the 9.8 percent poverty rate in Massachusetts determined by the official measure increases to 11.6 percent under the supplemental measure.
Rather than making a simple calculation of income, which is what the official measure does, the SPM makes several other adjustments, including adjustments in two key categories: 1) it adds noncash transfers received by households that help them make ends meet (e.g., the Supplemental Nutrition Assistance Program, Social Security and tax credits like the Earned Income Tax Credit); and 2) it adjusts income by local differences in cost of living.
Some states actually see reduced poverty rates under the Supplemental Poverty Measure, usually because their local cost of living is lower than typical. Massachusetts is at the other end of the spectrum, with our sky-high housing costs leading to an increased SPM rate. While this is a challenge for us in Massachusetts, several other states (and D.C.) see even larger increases under the SPM. California provides the most extreme example, serving as a cautionary tale: It moves from having the 19th highest poverty rate under the official measure to the second highest under the SPM. Home values in both Massachusetts and California have skyrocketed in recent years, but California’s increase since the peak of the recent housing crisis has been even more pronounced.
Some good news: Poverty in Massachusetts has declined.
While using the SPM makes clear that poverty in Massachusetts is more pervasive than the official measure indicates, the data released yesterday do show that we’ve made some important progress. The SPM shows a decrease from 13.7 percent in the 2009–2011 period to 11.6 percent for 2016–2018. That’s a 15 percent reduction in the share of Massachusetts residents living in poverty.
More good news: Public programs like Social Security and the SNAP (food stamps) are effective in reducing poverty.
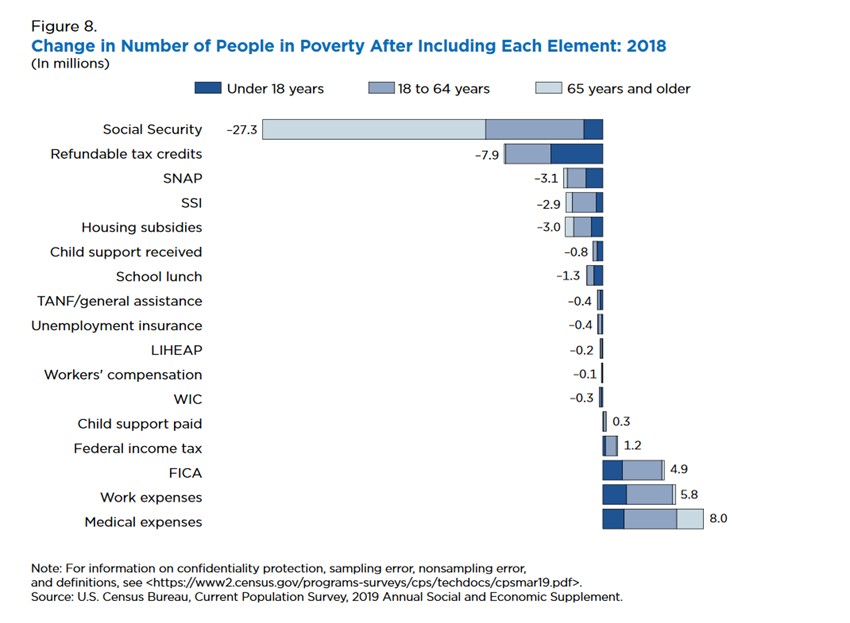
An invaluable feature of the Supplemental Poverty Measure is that it allows us to gauge how much different public programs work to alleviate poverty; since the measure counts noncash transfers received by households that help them make ends meet, researchers can back these out to see what the poverty level would have been if households had not received these supports. We can’t do this with the official measure, since it doesn’t count noncash transfers, making it appear that poverty has been reduced little in recent decades even though the government has invested in poverty-reduction efforts.
The Census Bureau graphic below provides estimates of the effect of these programs at the national level. Social security has by far the largest effect, bringing more than 27 million people out of poverty nationwide, followed by a range of refundable tax credits (like the Earned Income Tax Credit and the refundable portion of the child tax credit) that together lift almost 8 million people out of poverty.
Finally, for the first time ever the Census Bureau broke these effects down to the state level for one of these programs, SNAP, which provides food assistance to low-income families. In Massachusetts, SNAP reduced the number of people living in poverty by 54,000, with nearly half of them (24,000) being children under 18.
Focusing on these different estimation methods can feel a bit academic, but it actually matters a lot in terms of the federal policy-making debate. There are efforts afoot to cut many of these federal anti-poverty programs, including, for instance, through President Trump’s proposed 2020 budget—based on simplistic assessments of the official measure. This brief from the Center on Budget and Policy Priorities summarizes what’s at stake: Programs Targeted for Cuts Keep Millions From Poverty, New Census Data Show.
The Supplemental Poverty Measure is a useful new tool for improving our analysis of poverty in Massachusetts. It both gives us a better picture of how many people truly struggle to make ends meet, and it allows us to quantify the power of existing anti-poverty programs.


