Bus service essential to region during the pandemic.
By Anne Calef
November 11, 2020
Boston Indicators and the Center for Housing Data at the Massachusetts Housing Partnership wrote this brief with input from Transit Matters
Transit agencies nationwide have seen ridership decline during the pandemic, but many bus lines serving lower-income, frontline workers remain remarkably resilient. Ridership on New York City’s MTA is only one quarter of usual levels, for example, similar to the situation in Greater Boston, with MBTA ridership just 26 percent of what it was in October 2019. Actual declines have varied by type of transit, however. Since the beginning of the pandemic, MBTA and Regional Transit Authority bus lines have consistently regained a greater portion of pre-pandemic ridership than other modes of public transit. By September, MBTA commuter rail was still only 12 percent of 2019 levels and MBTA rapid transit ridership was at 24 percent. By contrast, MBTA bus ridership was back up to 41 percent.
Higher rates of bus ridership are not unique to the MBTA. Since the beginning of reopening this summer, bus retention rates for Regional Transit Authorities (RTAs) have been even higher than the MBTA’s, with RTA bus ridership up to roughly 50 percent (our RTA estimates are more rough, since we do not have data for the entire RTA system). RTAs serving the Gateway Cities of Worcester (Worcester Regional Transit Authority) and Pittsfield (Berkshire Regional Transit Authority) retained the highest percentage of riders. While some of the communities served by RTAs have commuter rail access connecting to Boston, these regional bus systems constitute the primary transit infrastructure in the state outside of Greater Boston.
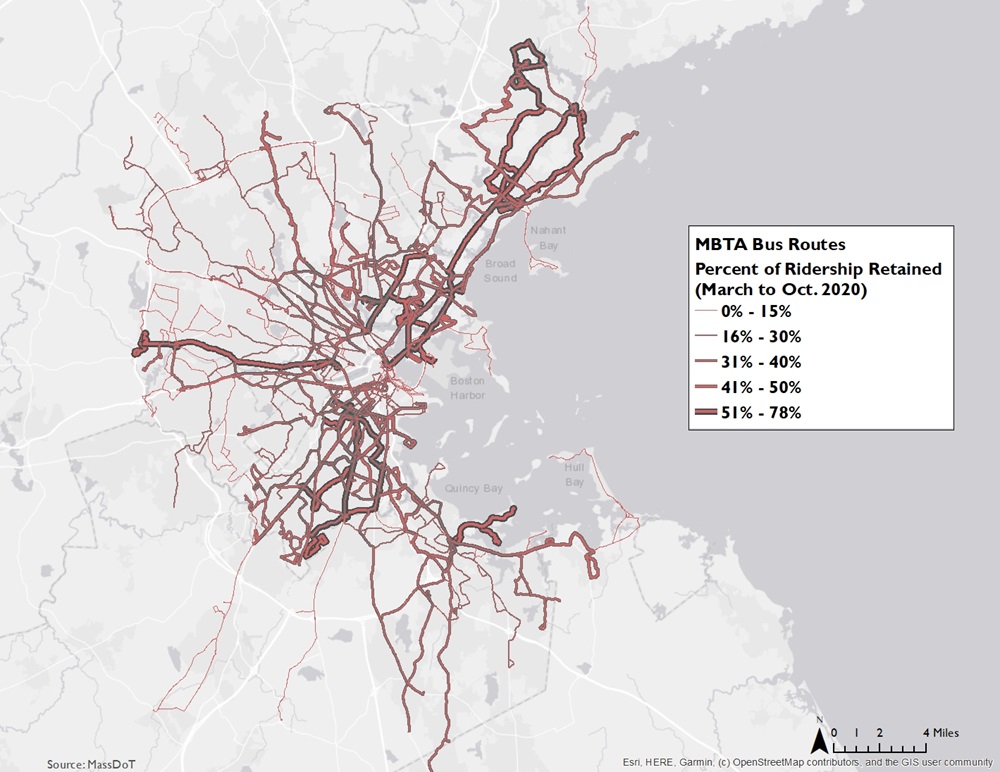
Retention of bus ridership also varies greatly from line to line across the system. Looking more specifically at each MBTA bus line, we see that ridership retention ranged from below 15 percent to 78 percent of 2019 levels and that many of the bus lines with the highest levels of retention served communities immediately north and south of Boston.
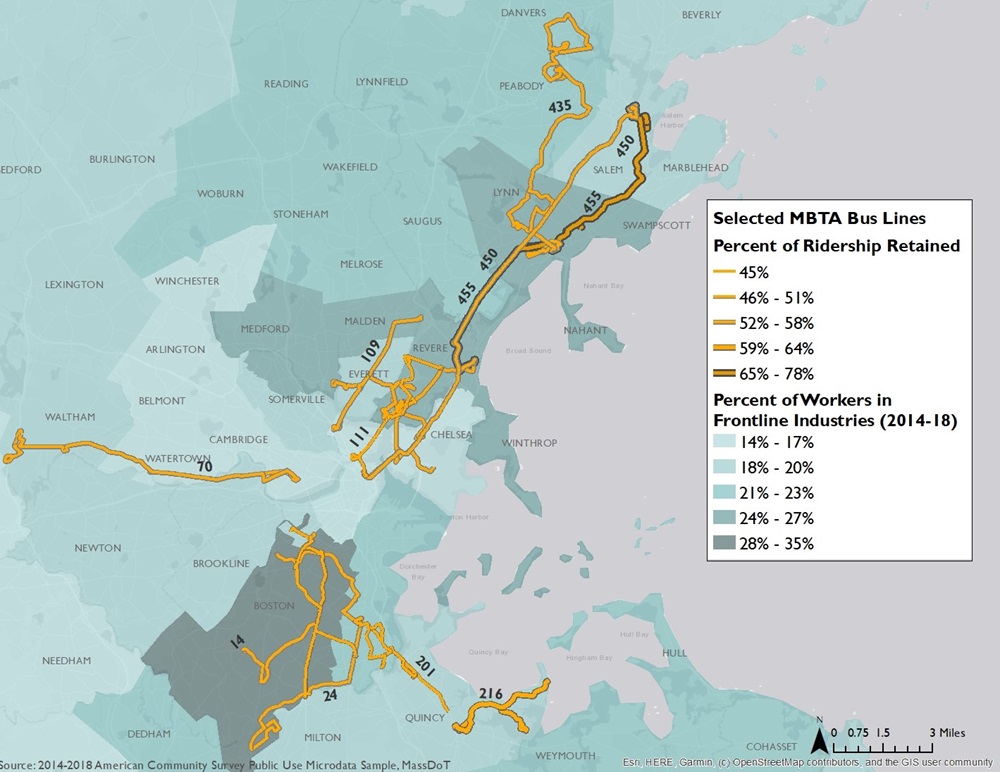
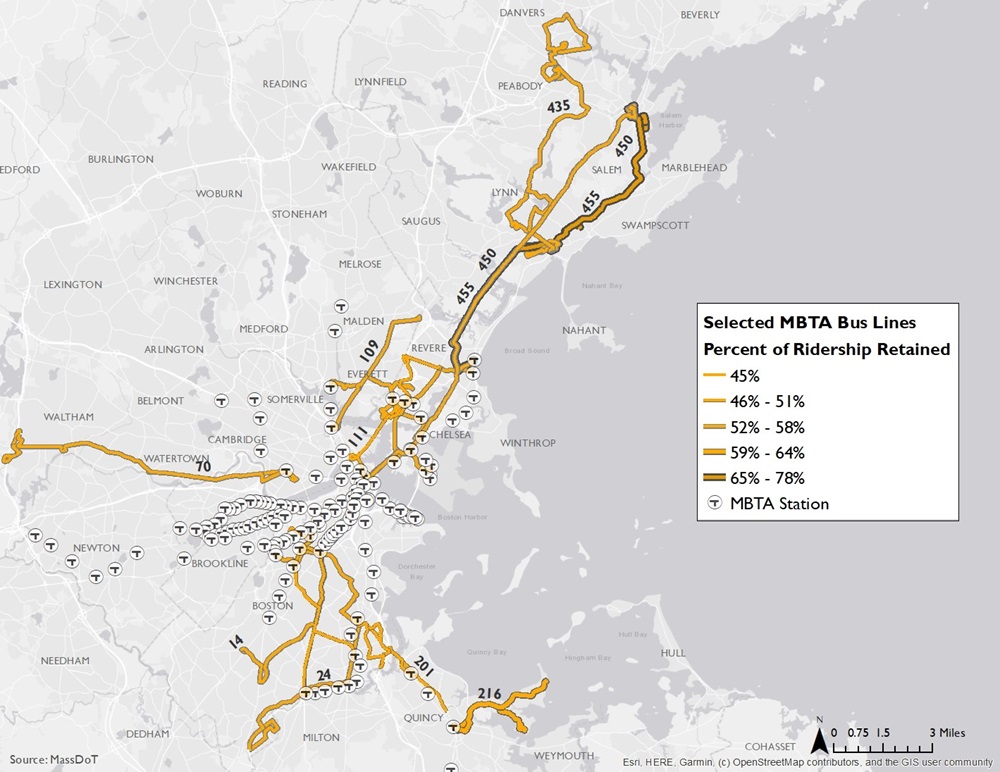
In order to further explore these ridership trends, we isolated and examined 15 bus lines with the highest average weekday retention during the pandemic, as shown in the table below.
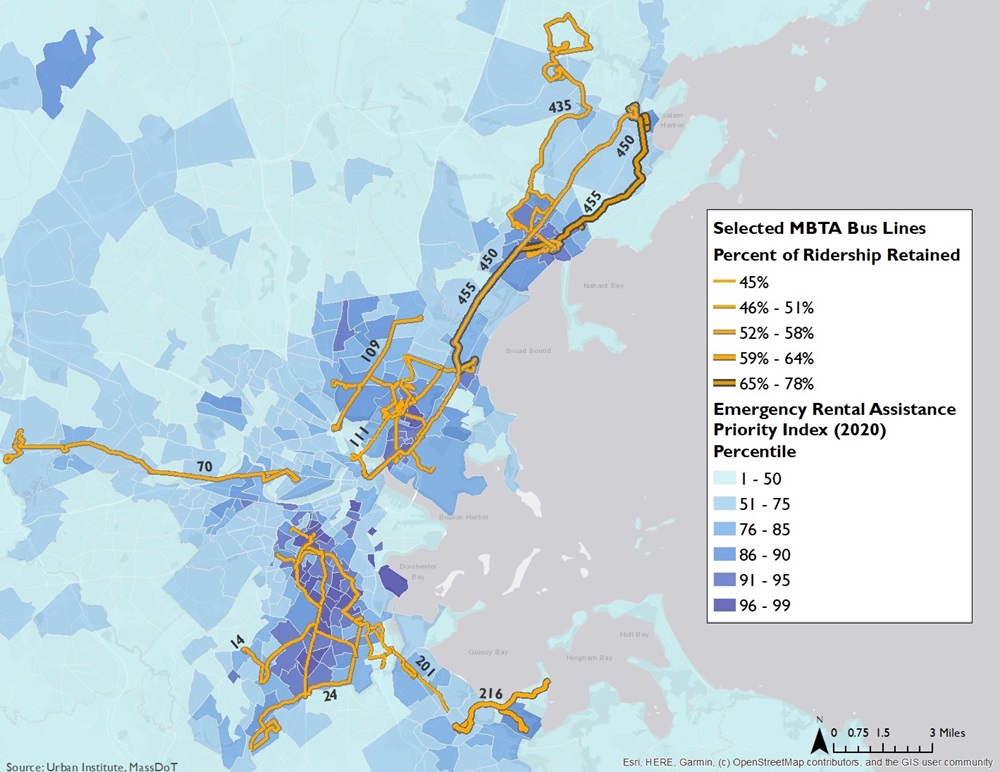
The communities served by the most resilient bus lines are also some of the hardest hit by the recent economic downturn. Using the Urban Institute’s Emergency Rental Assistance Priority Index, we see that the lines run through areas where residents are at greater risk of housing instability and homelessness. The index measures anticipated need for emergency rental assistance by analyzing different neighborhood condition and demographic variables, including the share of severely cost-burdened renters, share of people living in poverty and share of low-income jobs lost to COVID-19. Emphasizing an “equitable approach,” the index further accounts for “risk factors that are higher for certain groups, particularly Black, Indigenous, and Latinx renters” due to a history of systematic exclusion from housing and economic opportunities.
Laying the 15 most resilient bus lines over the index highlights a key point: Resilient bus lines are serving communities that most acutely feel the weight of the pandemic. Service changes thus have the potential to further exacerbate the effects of pre-existing inequities that have been intensified by the pandemic.
The MBTA has sought an equity-based approach in its “Forging Ahead” plan for COVID-related service changes, defining “essential services” routes as ones that both have high ridership (current or propensity) and serve high transit-critical populations (travel demand measure capturing where low income people of color and people in zero- and low-vehicle households traveled in July–August 2020). Indeed, the MBTA has increased service for some of the most durable lines in order to enable safe social distancing on board. However, even as the MBTA targets non-essential bus services for cuts, the current proposal still calls for an average five percent frequency reduction system-wide for essential bus routes (to be determined by ridership). Further, the proposal calls to end all bus service at midnight, limiting access for 1,748 late night, often transit-dependent riders. Several of the lines documented here (70, 112 and 450) were not considered essential and may be “significantly reduced throughout the day” to reach a system-wide frequency reduction of 20 percent.
Public transit, and specifically buses, have been instrumental to frontline workers’ mobility and thus our region’s economic health now, and economic recovery in the future. While revenues for public transit may be down, its importance has never been higher. These changes, slated to begin in late June 2021, threaten to stall an emergent recovery, especially when coupled with deep cuts to other MBTA services.
1 Share of workers in frontline industries calculated from ACS 2014-2018 5-year Public Use Microdata Sample data using methodology from the Center for Economic and Policy Research that follows the New York City Comptroller’s definition of workers in frontline industries.


