9 Key Findings About Wealth in 2022

By Luc Schuster and Peter Ciurczak
November 1, 2023
Newly released data from the Survey of Consumer Finances (SCF) provide our first picture of wealth coming out of the pandemic. And it reveals some surprising, largely positive, trends. Unfortunately, though, huge wealth inequality remains.
The SCF is a large national survey conducted every three years by the Federal Reserve, gathering detailed information on the economic security of American families. We rely on this data for much of our research on racial wealth equity, but due to some data limitations, we unfortunately cannot analyze data at the state or local level—see our recent Racial Wealth Equity Chartbook: National Trends and the Challenge of Local Data for more detail.
In this brief we offer nine key findings from this new data. Stay tuned for more detailed analyses of this rich data in the near future.
1) Wealth increased significantly from 2019 to 2022.
Inflation-adjusted wealth increased for most demographic groups between 2019 and 2022. At the median, net worth jumped from $141,000 in 2019 to $192,900 in 2022. This 37 percent increase is the largest three-year jump since the Fed started administering this version of the survey in 1989. This really is good news. Many of us worried the pandemic was going to exacerbate inequality, but due in part to the federal policy response, which distributed cash assistance to a wide range of families and businesses, economic security and net worth increased for almost all subgroups. In fact, the federal response to the pandemic was so large that it contributed to high rates of inflation that have made more people concerned about the economic future coming out of the pandemic (see key finding #9 for more).
2) Asian Americans have the highest wealth of any racial group.
Reflecting greater efforts to survey Asian American households, the 2022 SCF reports data for Asian American wealth for the first time, finding that at the median, Asian wealth is almost twice White wealth and greater yet than Black and Latino wealth.
As with all groups, crude racial categorizations mask large intra-Asian disparities, so this finding should not be interpreted to suggest that no Asian families struggle with economic insecurity. SCF data are national, but we know from previous research we did in partnership with the Asian Community Fund that despite being home to many high-income/high-wealth Asian American families, Greater Boston is also home to many lower-income/lower-wealth Asian American families. In fact, it’s likely that Asian Americans have the largest intragroup inequality of any racial group in the region.
3) Black and Latino wealth increased less than White wealth in real dollar terms but more as a percentage.
Median net wealth increased for all racial groups from 2019 to 2022—White wealth increased by $67,000 in inflation adjusted terms, Black wealth by $17,000, and Latino wealth by $20,000. As a percentage, however, Black and Latino wealth both increased by more than White wealth (60 percent and 47 percent respectively compared to 31 percent for White households).
For the SCF, “Other” is a diverse clustering of smaller racial groups that were not sampled at a large enough size to produce reliable estimates on their own. This group includes those identifying as Asian, American Indian, Alaska Native, Native Hawaiian, Pacific Islander, other race, and multiracial. Asian households make up about 30 percent of this large “Other” grouping although, as we discuss above, 2022 was the first year for which Asian totals are broken out on their own. Asian households are clustered back into the large “Other” category in this graph for the purposes of looking at longer-term trends.
4) Average net worth surpassed $1 million.
Most analyses of net worth look at the median because that focuses on the economic picture of a typical American household at the middle of the distribution. And using medians has the benefit of not letting large outliers skew the story. But there’s also a large difference between median and average wealth, reflecting the fact that wealth in the United States is heavily concentrated at the top of the distribution. As of 2022, average net worth in the United States was estimated to be at $1,064,000, compared to median net worth of $192,900.
Like the story at the median, while net worth increased for all groups, in straight dollar terms, average net worth increased even greater for White families than for other groups. In fact, at the average, the gap between White and Black wealth increased to above $1 million for the first time—average White wealth was $1.37 million in 2022 compared to $211,000 for average Black wealth.
5) The richest decile of households is overwhelmingly White, while the poorest decile is far more multiracial.
As we see whenever we look at the racial composition of the highest-income, highest-wealth Americans, 2022 SCF data again show that the richest households are overwhelmingly White (decile 10 below), according to the People’s Policy Project’s Wealth Distribution in 2022. In contrast to the richest deciles, the bottom half of the distribution is quite multiracial, with Black and Latino families overrepresented at the lower end. White families are underrepresented at the lower end, but they still make up a slim majority of the lowest-wealth decile.
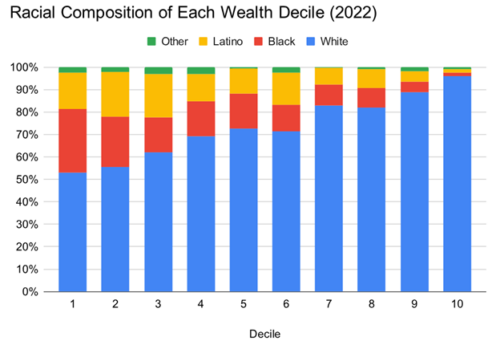
Image from Wealth Distribution in 2022, Matt Bruenig, October 23, 2023
6) Wealth inequality declined a bit, but it remains high across almost any dimension.
Because the rate of wealth increases for families of color and lower-income families was a bit higher than for other groups, wealth inequality under most measures declined a bit between 2019 and 2022. It’s striking, however, how unequal the wealth distribution remains, regardless of which groups of Americans one compares. The United States is a wealthy nation, and we continue to distribute these riches quite unevenly. Other analyses of the SCF data show large disparities within racial groups (rather than just across them), within educational attainment groupings, and within narrow age bands.
Looking just at the 2022 data, we see that the vast majority of all household wealth is held by the wealthiest 10 percent of families, who at the median have almost $3.8 million. Families in the bottom quarter of the distribution (the lefthand bar below) barely have any net wealth at all ($3,500 at the median).
The below graph from America’s Record Wealth Boom by economic analyst Joseph Politano compares the wealth distribution at a more granular level for 2019 and 2022, showing a very modest flattening of this hockey stick-shaped curve in 2022. But in broad strokes, the unequal shape of the distribution remains quite similar across the two periods.
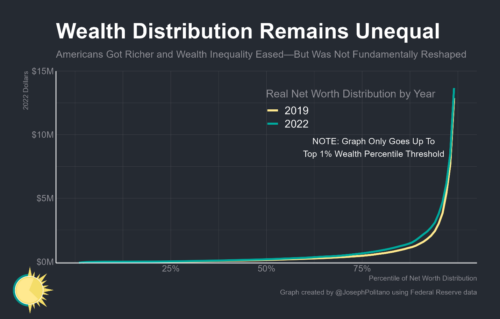
Image from America’s Record Wealth Boom, Joseph Politano, October 26, 2023
7) The White/Black and White/Latino racial wealth gaps declined somewhat but remain significant.
Looking at the ratio of one racial group’s median wealth to another’s offers one way to quantify the size of racial wealth gaps. For many years the White/Black and White/Latino ratios have hovered at between 8 and 10, meaning that the typical White family has 8 to 10 times as much wealth as the typical Black or Latino family. These ratios have declined somewhat in recent years, as shown below. Nonetheless, the typical White family still had 6.3 times as much wealth as the typical Black family in 2022 and 4.6 times as much wealth as the typical Latino family.
We cannot display Asian wealth below because the data are not available for years prior to 2022, but the Asian/Black and Asian/Latino gaps in 2022 are even more striking. Asian wealth is 11.9 times higher than Black wealth and 8.7 times higher than Latino wealth.
8) Housing wealth drove increases for all racial groups
Housing wealth was central to net wealth increases for all racial groups, especially for Black and Latino households. Interestingly, the homeownership rate increased for all groups except White households, but large racial homeownership gaps remain.
The three years from 2019 to 2022 mostly captured a period of declining mortgage interest rates and rising real estate values. Interest rates did start increasing in 2022, but that occurred late during this three-year period.
While this is great news for homeowners, encompassing much of the American middle class, these trends are another manifestation of increasing inequality, as homeowners made out far better than renters. Specifically, the median homeowner saw their net worth increase by $101,000 from 2019 to 2022 (the majority of which came from home value increases), while the median renter saw their net worth increase by only $3,100.
9) Despite the good news about the prior three years, families reported increasing concern about the economic future.
Most of the detailed SCF survey—which can take upwards of two hours per respondent to administer—focuses on one’s current financial picture. But it also asks questions about people’s perceptions of the economic future. And here there’s a striking shift. Despite the largely positive trends from 2019 to 2022, families reported meaningful increases in concern about their economic future going forward. This graph shows the share of families that said they did not have a good idea of what their family income would be in the next year. All groups reported meaningful increases from 2019, with Black and Latino families approaching 60 percent. The SCF also asks a question about respondents’ expectations of economic performance overall, rather than anything specific to their household, and all racial groups also reported an increase in expectations for a worse economic picture in the next five years.
These data represent two distinct points in time—2019 was the last full pre-pandemic year and 2022 came as we started coming out of the pandemic. There’s clearly a lot that shapes people’s expectations about the economic future, but it seems likely that at least one factor driving increased concerns in 2022 was rising consumer inflation. Inflation has slowed over the past year, but that wouldn’t have been captured by this survey and while many economists and pundits were anticipating a recession, so far that has not come to pass.