
The Still Segregated City
By Anise Vance
October 20, 2015
In 1915, Connecticut’s tobacco growers faced a crisis: their cheapest source of labor, European immigrants, had left the tobacco fields. Some had returned home, ready to fight in what would be the century’s first world war. Others were drawn to the relatively high wages offered by the booming war industries. Desperate, Connecticut’s tobacco growers contacted the National Urban League in hopes of “experimenting” with black southern laborers. Soon, Connecticut’s tobacco fields were filled with black workers and other industries, seeking their own pool of cheap labor, caught wind of the experiment. In less than a year, the idea had spread throughout the Northeast and between its industries. The first Great Migration was thus, through the efforts of tobacco growers, given an enormous push.
Northeastern and Midwestern cities owe much of their current geographic arrangement to the first Great Migration. Laborers’ places of residence were often designated by the industries that drew them north. Critically, those geographies held certain commonalities across cities: they were close to the laborers’ place of work, segregated from white residential areas, and unsanitary and decrepit in the condition of their housing. Often, blacks and recent European immigrants would occupy the same or adjacent neighborhoods. Segregation by class and segregation by race and ethnicity was thereby quickly implemented and fortified. Wealthy Anglo-Saxons were well separated from the poor Eastern Europeans, Italians, Irish, and blacks that provided cities with manual labor.
The nation’s relentless pattern of housing discrimination continued well past the first Great Migration. In the following decades, a plethora of tools, both legal and illegal, were used in confining immigrants, blacks, and the poor to well-defined geographic areas. Wide-scale redlining, discriminatory housing contracts and neighborhood agreements, inflated rents, artificially high taxation, neglect of property, and physical violence were all used in efforts to maintain strict boundaries. Even as many of the above methods were outlawed during the civil rights era, subtle forms of discrimination emerged, plaguing housing markets across the country. Unequal lending practices, racial steering in the real estate market, home buyers’ biased housing preferences, and white flight have all stood in the way of genuine and lasting integration.
In Boston, a particularly fascinating piece of history gave rise to the city’s current spatial arrangement when, in the 1960s, the Federal Housing Authority reversed its longstanding and discriminatory mortgage lending policies. Suffering from the same uneven housing patterns as many other American cities, the city of Boston encouraged banks to offer FHA-insured loans and mortgages to the city’s black population. The city’s request led to the establishment of the Boston Banks Urban Renewal Group (BBURG), a consortium of banks.
While the consortium did indeed offer Boston’s black population mortgages, it also stipulated the very particular neighborhoods in which those loans could be used: parts of Roxbury, Dorchester, and Mattapan. The initial, and equitable, impulse toward fair lending practices was soon subverted. The consortium drove out populations in Roxbury, Dorchester, and Mattapan, and manufactured a carefully drawn inner-city in their stead. Needless to say, rampant speculation, blockbusting, and rapid demographic transitions led to violence and rage in the areas BBURG targeted. Mattapan, in particular, saw much change. What was a long-established and middle class Jewish community became, in only a decade, a lower-income black neighborhood suffering from inflated housing prices and unreasonable loan agreements.
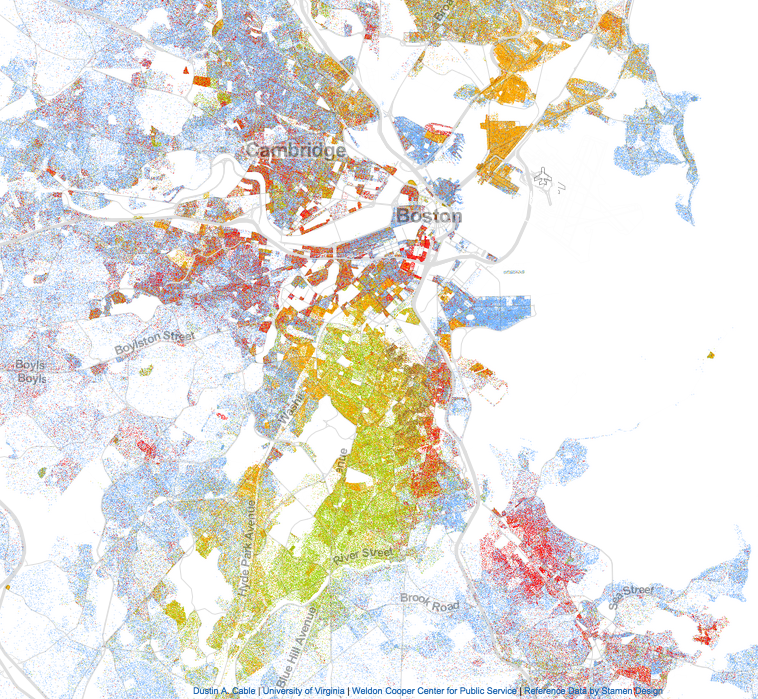
The 20th century’s legacy of housing discrimination against immigrants, blacks, and the poor still defines Boston’s geography. The most common measure of segregation, the dissimilarity index, sheds light on the extent of separation between Boston’s economic classes and racial groups. Measured on a scale of 0 to 100, the dissimilarity index is a measure of unevenness across space. According to Brown University’s S4 project, “a value of 60 (or above) is considered very high. It means that 60% (or more) of the members of one group would need to move to a different tract in order for the two groups to be equally distributed.”
In 2010, the dissimilarity index between blacks and whites in Boston was 69.2. Between Hispanics and non-Hispanic whites, it was 54.6. Not surprisingly, between blacks and non-black Hispanics, the dissimilarity index stood at 39.6. While all three figures have fallen since 1980, by approximately 9, 5, and 12 points, the causes of those drops may not suit versions of history that highlight increasing racial integration. Much of the residential mixing can be accounted for by steady gentrification: what may be a mixed geography today is likely a racially uniform neighborhood a decade from now.
Further exacerbating Boston’s geography is the startling upward trend in segregation by class. In 1970, the proportion of families in the Boston Metropolitan Area living in poor neighborhoods was 8%. By 2011, that figure rose to 20%. Over that same time period, the proportion of families living in affluent areas grew from 5.6% to 15.3%. Other indices of income segregation confirm the above figures: in Boston, segregation by class is steadily increasing, threatening to reinforce already firm class-based boundaries.
The consequences of living in a severely polarized city can be dire. In our next piece, we will explore the effects of segregation on individual, and collective, social and economic opportunity.