
Education, Income and Race in Two Receiving Neighborhoods
By Peter Ciurczak
December 13, 2016
While touched upon briefly in The Geography of Incarceration, a closer look at Boston’s receiving neighborhood demographics - where the formerly incarcerated return to live - is essential to a deeper understanding of Boston’s prison population. What the report reveals is a variety of systemic failings within the city itself, failings that play out in the real world as a significant imbalance within Boston regarding who is incarcerated, versus who is not. There are neighborhoods here with such high rates of incarceration that, as the report notes, “nearly every street – in some cases every other building – contains a resident who has been incarcerated.” Most of these neighborhoods are demographically dominated by Boston's minority populations.
Two of these neighborhoods are of note for the purposes of this article - Franklin Field and Grove Hall. Both of these neighborhoods feature some of the highest housing and jail costs per square mile in Boston. In Franklin Field, the population demographics of the area roughly break down to 65% Non-Latinx Black, 20% Latinx, 4% Non-Latinx Asian and only 5% Non-Latinx white. In Grove Hall, with the second highest costs per incarcerated person, it’s 63%, 27%, 1% and 2% across these same demographics. Nationally, we’ve seen that communities of color are often more highly represented in correctional systems for a variety of reasons, and Boston is no different. Indeed, as the report notes, these communities are disproportionately represented in Suffolk County’s correctional system whether through institutional bias, “inequality or variation in the seriousness of offenses” – even as Boston’s reported crimes are more evenly spread geographically.
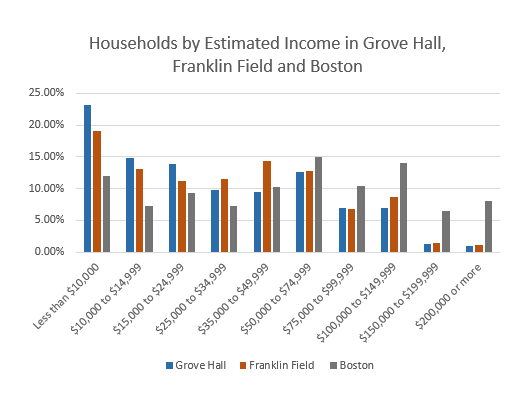
Intertwined with these incarceration issues are those of income and education. The Suffolk County’s corrections system has a heavy influence on neighborhoods that are some of the most impoverished and least educated in the city itself. In Franklin Field, roughly 67% of the population makes under $60,000 - the rough annual take-home wages of a family of three - while 31% of the population makes under $20,000 - poverty level income for a family of three. Grove Hall statistics tell similar stories – 74% of the population in Grove Hall makes under $60,000 – while a whopping 40% make under $20,000. Perhaps unsurprisingly, we also see a significant difference in the highest level of education completed between Boston as a whole and these neighborhoods. In Franklin Field, individuals with higher education degrees account for around 27% of the population, while in Grove Hall the percentage is even lower. Roughly 20% of Grove Hall residents hold higher education degrees. As one of the most highly educated cities in the United States, many of Boston’s higher paying jobs reflect the premiums placed on higher education in order to be prepared for jobs in technology, medical instruments and health care. As a result, many of these high-skill, high-wage jobs are unfortunately often closed off to residents of Franklin Field and Grove Hall.
Criminal justice reform in Boston is a multi-faceted problem. Reformers must not only look at the real costs of incarceration as defined throughout the report – but also the contributing factors that drive Boston’s incarceration rates. Finally we must address the costs of inaction – of neighborhood disinvestment and, ultimately, unequal access to opportunities.