A Decade of Boston Elections, in 11 Graphs
By Peter Ciurczak and Luc Schuster
October 27. 2017
Editor’s Note, November 8, 2017: We have updated some of these charts with information from the unofficial totals released by the City of Boston for the November 2017 elections.
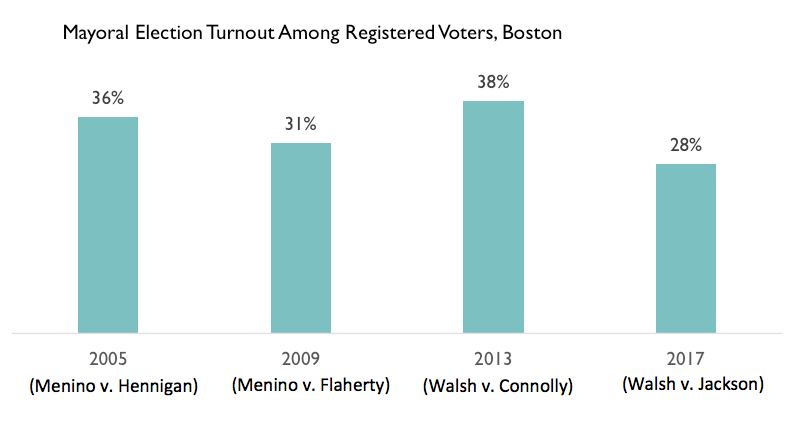
1) Unofficial election results suggest that voter turnout for Boston's 2017 mayoral election was lower than in any of the three previous elections.
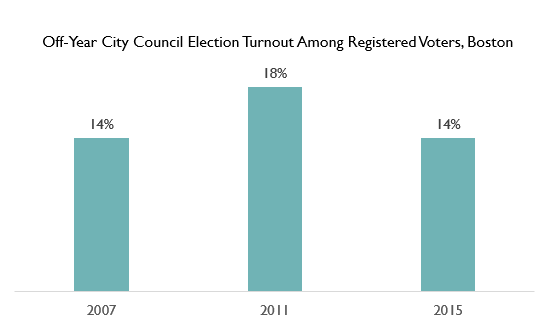
2) Voter turnout is much lower in off-year city council elections.
Only 1 in 7 registered voters (14 percent) cast a vote in the 2015 off-year city council elections. That’s less than half of voter turnout in the 2013 mayor’s race.
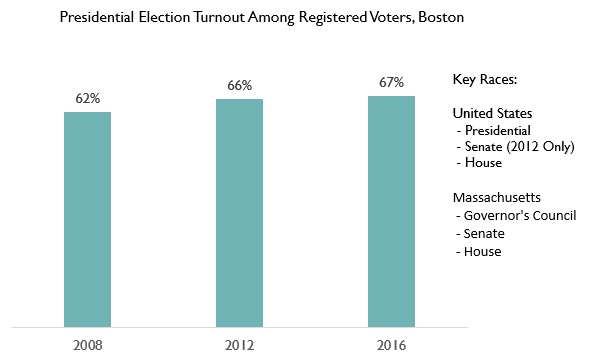
3) Turnout is significantly higher when federal and state races are on the ballot.
Roughly two-thirds of voters cast ballots in the two most recent presidential elections.
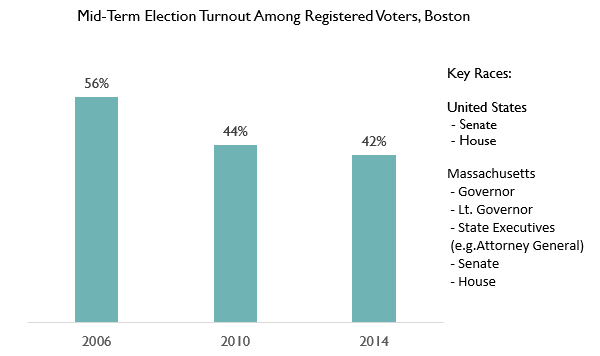
4) While turnout goes down a bit for mid-term congressional elections, it’s still higher than turnout for mayoral elections in Boston.
Turnout for the last two mid-terms was in the low-40 percents, whereas turnout in the last mayoral election was 38 percent (and that was with no incumbent running). Additionally, mid-term turnout has fallen since 2006, the last time a Republican held the White House. Research has shown that voter turnout in mid-term elections is higher amongst partisans of the opposite party to the sitting President; in 2017, 52 percent of registered Boston voters are Democrats, whereas only 6 percent are Republicans.
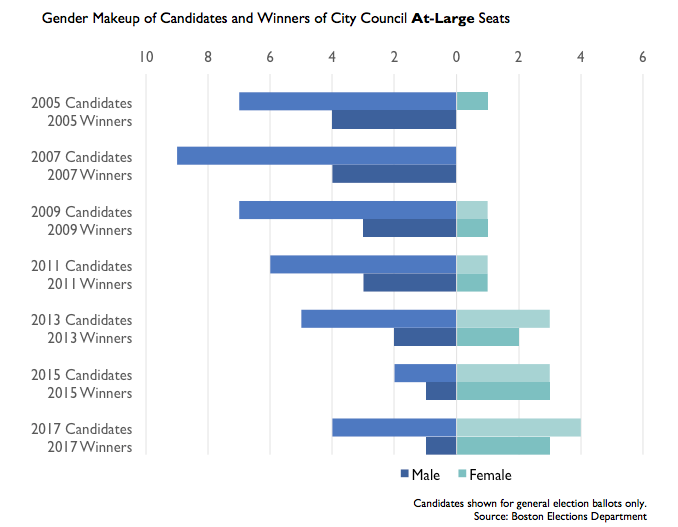
5) Women are running for, and winning, more at-large city council seats.
After the 2005 and 2007 elections, men held all four at-large seats. After the 2013 election, the at-large seats were evenly split male/female. And since the 2015 election, women have held three of the four seats, a gender distribution carried through the 2017 elections.
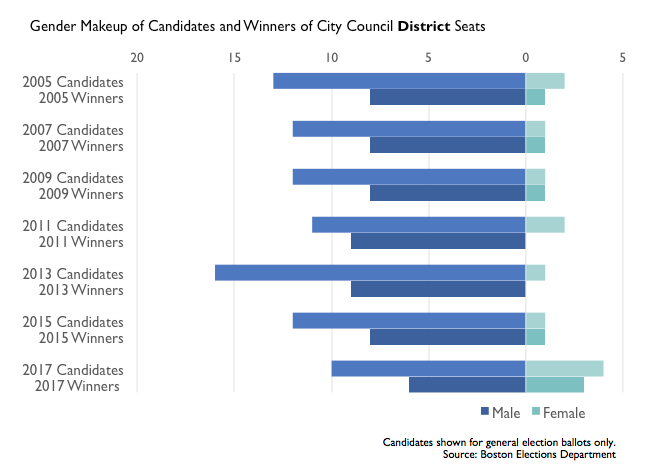
6) Women now hold three district seats - more than at any point in the last decade.
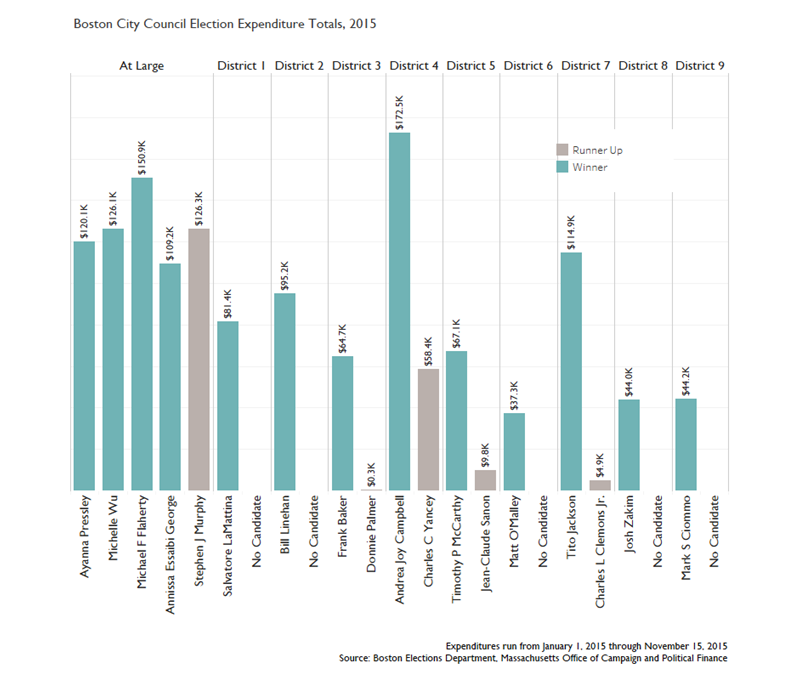
7) Candidates for at-large seats tend to spend significantly more than candidates for district seats.
Tito Jackson and Andrea Campbell were two district candidate outliers, spending amounts more typical of at-large campaigns.
Also, while higher-spending candidates tend to do better, higher spending didn’t guarantee victory for at-large seats in 2015.
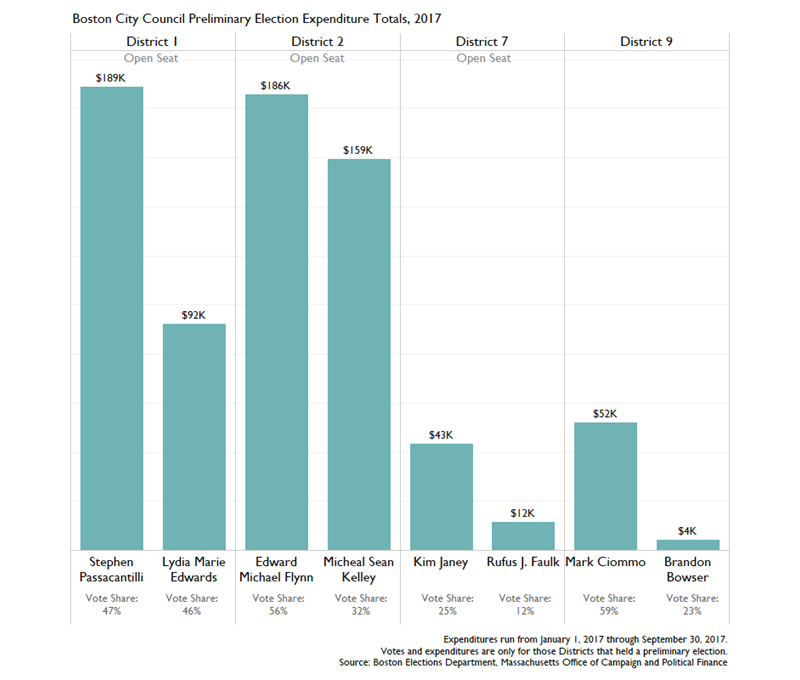
8) In the current 2017 race, two candidates for district seats have already spent more by the end of September than any candidate did over the whole 2015 race.
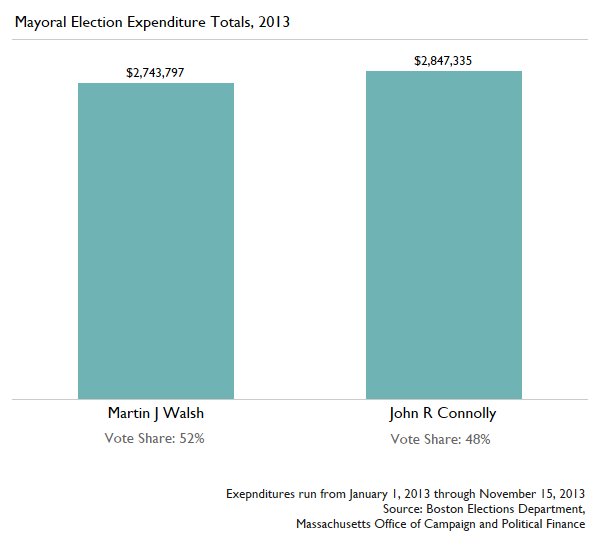
9) In the 2013 mayoral race, Marty Walsh defeated John Connolly 52-48, despite spending a bit less on his campaign.
The 2013 mayoral race was the most expensive race in the last decade, with both candidates combined spending upwards of $5.5 million. The second most expensive race – 2009’s mayoral race – saw Mayor Menino and Michael Flaherty spend a combined $4.4 million (in 2013 dollars).
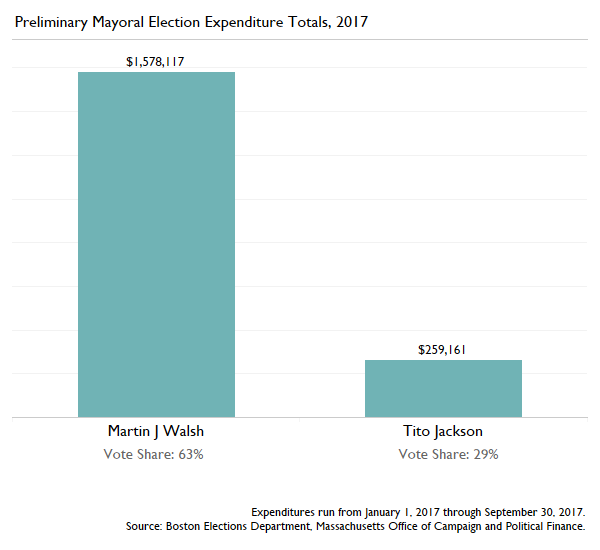
10) By September’s preliminary election, Mayor Walsh had spent six times as much money as Councilor Jackson and garnered twice as much of the vote.
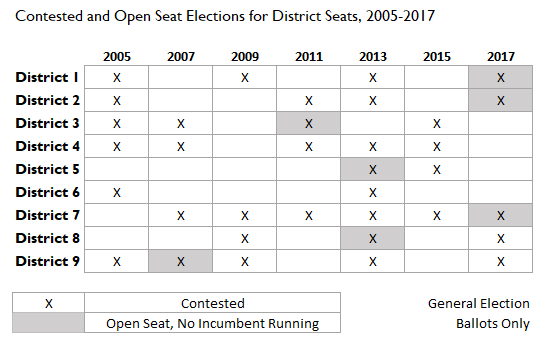
11) District seats have gone uncontested 44 percent of the time since 2005.
And 3 out of 9 seats have been contested less than half of the time (Districts 5, 6 and 8).
And for the four at-large seats in 2017, all four incumbents are running along with four challengers.

