

Preface
The United States Census dates back to the birth of the Republic. It is a tool central to our mode of government, given that the count determines representation in the U.S. House of Representatives, and therefore in the Electoral College. It also determines per state funding from the federal government, and is used by states and regions for more local governance issues. In addition, researchers and planners in the public and private sector widely use Census information.
The Census most effectively represents and gives proper federal funding to everyone if we all participate. A Census that accurately counts most people living in the United States would not be possible without significant collective effort to ensure its success. In light of tenuous government funding for outreach, all of us—from major philanthropies to grassroots organizers—should work together to ensure that the importance of the Census is communicated effectively and tirelessly through to its completion.
The Census has clearly changed its mechanisms since 1790—from marshals visiting every household on horseback to a mostly online count—which has generally led to improved accuracy. But at times Census operations have been a political football, with real human consequences. The current move to add a question about citizenship falls into that category, as it is expected to depress the response rate among particular populations. This is not the first, nor will it be the last, in a long line of such issues.
Political arm-wrestling through the guise of the Census may be inescapable, so it is essential to have civically-minded researchers remind us of some significant challenges, like how to find and count each resident once, what questions a person could answer accurately and without fear, how to store data securely, and how to enumerate and calculate the numbers and percentages precisely and fairly.
We’re very pleased to present this Boston Indicators research report on the current state and prospects of the U.S. Census, in an effort to increase the odds of an accurate count.
Our Commonwealth depends acutely on the accuracy of the decennial count, as a small but populous state. With many students, renters, non-family shared households and immigrant residents, our population is ever-changing and especially hard to count. Some $16 billion in federal funding could be affected. That is why this research is more important than ever.
We hope sharing this information will spur deeper investigations into Census best practices, and help those in the campaign to “get out the count” for 2020.
| Paul S. Grogan | Alexie Torres | |
| President and CEO | Executive Director of Access Strategies Fund |
|
| The Boston Foundation | Chair of the Massachusetts Census Equity Fund |
About The Massachusetts Census Equity Fund 2020
The Massachusetts Census Equity Fund 2020 is a collaboration of funders from across the Commonwealth working together to educate and engage partners on the importance of the census. We are coordinating a statewide grant process targeting support to community-based organizations working to ensure a fair and complete count in their communities. We know a statewide organizing strategy will result in the most accurate count and thus the appropriate federal funding of essential programs in our state. By organizing a broad coalition of partners, we will have a significant impact that will carry our Commonwealth into the next decade.
To learn more about the work of the Massachusetts Census Equity Fund 2020 contact:
Alexie Torres, Chair, atorres-fleming@accessstrategies.org
Katie Campbell Simons, Project Consultant, masscensusfund@accessstrategies.org
Key Takeaways
WHAT'S AT STAKE FOR BOSTON AND MASSACHUSETTS
- Conducting an accurate Census is critical for helping ensure that federal funding—roughly $16 billion for Massachusetts in Fiscal Year 2015—gets to the people and projects it’s intended to support. Much of this funding helps the most vulnerable among us, providing, for instance, healthy food and child care for low-income families.
- Accurate counts also matter a lot at the city and town level. The federal government provides financial assistance to communities and schools that have higher numbers of children in poverty to ensure they have the resources to help children meet challenging academic state standards. These funding allocations are based primarily on census poverty estimates.
- Boston has among the lowest Census return rates in the nation. Due to our large proportion of renters, college students and recent immigrants, Boston is ninth hardest to count among the largest 100 U.S. cities and is the most hard to count among a set of eight similar cities. Get out the count organizing is important everywhere but is especially important in places like Boston that have had lower return rates.
- Other urban areas in Massachusetts, especially Gateway Cities like Lawrence and Fall River, have very low Census return rates. Getting an accurate count in these places is especially important because they are home to disproportionate shares of the state’s people of color and recent immigrants.
- Massachusetts is not likely to lose or gain a seat in the federal House of Representatives based on Census 2020. But if vulnerable populations go undercounted within Massachusetts, they risk being underrepresented in state and local offices when local political boundaries are redrawn.
- Local nonprofits play a key role supplementing official U.S. Census Bureau efforts to get out the count. The Massachusetts Census Equity Fund has already begun to prepare for the 2020 count by: 1) raising funds for local outreach efforts; 2) educating the public about why an accurate Census is so important; and 3) beginning to coordinate efforts to increase response rates in hard to count communities in 2020.
EMERGING ISSUES RELATED TO CENSUS 2020
- Federal funding for Census 2020 is well below funding levels at equivalent points in previous 10-year Census funding cycles.
- Low federal funding is especially concerning because mail-in response rates declined from 78 percent in 1970 to 63 percent in 2010. The Census Bureau requires greater resources to conduct in-person outreach to households that do not respond to initial Census mailers.
- The Census Bureau plans to include a new question on citizenship status, which it did not test rigorously for its potential to depress response rates. The addition of a citizenship question is being challenged in federal court.
- Respondents will complete the Census fully online for the first time, adding new challenges for ensuring that even those without ready access to the internet complete their questionnaires.
- The Census Bureau has made efforts to protect personal data that it receives. Federal law prohibits the Census Bureau from sharing any identifying information either with public or private entities.
- Advocates have been pressuring the Census Bureau to improve how it gathers data on race/ethnicity and LGBTQ populations. The Bureau has made small tweaks to how this information is gathered but Census 2020 will miss an opportunity to restructure these questions more broadly in order to gain better data on these populations.
Overview
The United States Census is the oldest regularly recurring data gathering exercise in the world. It provides invaluable information about who makes up our large, diverse country, and it helps us analyze how we’re changing over time. Since it won’t happen again until 2030, results from the 2020 count will have decade-long implications for how particular communities are represented and for how resources are distributed across our cities and towns. On a very practical level, the Census is used to draw political boundaries and to direct government resources that support critical public programs (e.g., the school lunch program and housing vouchers for low-income families). It is also used by people doing all sorts of research in order to better understand and make decisions that affect the future of our communities.
To ensure that important decisions are driven by accurate data, the Census effort has to be big—and it is. Census 2010 was billed as the largest peacetime mobilization in American history, and Census 2020 looks to be even larger.
An accurate Census is particularly important for Boston, one of the hardest to count cities in the nation. In 2010, Boston had the ninth-highest share of people living in hard to count (HTC) Census tracts among the 100 largest U.S. cities. But Boston is actually the hardest to count when compared to seven similar U.S. cities, according to a new analysis detailed later in this paper. Why? Boston has large shares of several populations less likely to return their initial census form, including renters, people living in group quarters (e.g., college dorms), and recent immigrants who often have less trust in government. Reaching these populations in Boston, as well as in the state’s Gateway Cities and other HTC areas, is critical to any Census 2020 organizing.
This report is designed to support active engagement in local efforts around Census 2020 and is organized to answer the following questions:
Part 1 – What Is the Census?
Part 2 – What Areas in Boston and Massachusetts Are the Hardest to Count?
Part 3 – How Do Census Counts Affect Federal Funding to Massachusetts?
Part 4 – What Are the Emerging Issues of Census 2020?
Part 5 – How Are Local “Get Out the Count” Efforts Being Organized in Massachusetts?
Appendix A – How Does the Census Count People?
Appendix B – What Questions Are on the Census and How Have They Changed?
Part 1 – What is the Census?
The Census was first administered by federal marshals in 1790. It’s been administered in 10-year intervals ever since, with operations taken over by the Department of Commerce in 1903. The 1790 Census resulted in a nationwide population count of 3.9 million, a number that included slaves counted as three-fifths of a whole person. Altogether, this population count was lower than leaders of the era—Washington and Jefferson among them—expected. Questions of accuracy would prove to be a recurring theme, and, as a result, the modern decennial Censuses include procedures to check the accuracy of the count.
There have been a total of 22 Censuses since the 1790 Census, often undertaken with very different enumeration (counting) methods and question wording. Most recently, Census 2010 was mailed to every residence in America. Census 2010 reported a national count of 308 million people, in one of the most accurate Censuses to date.
IMPACT AND INFLUENCE
Political boundaries are drawn using Census data.
Data from the United States Census is at the very heart of American representative democracy, and has been ever since the Census was ratified as part of the U.S. Constitution in 1788. Population data from the Census is used to apportion political representation at all levels of government including:
- Federal House of Representatives. Census population counts are used to determine how many seats in the House a state receives. Once determined, states draw their own district boundaries using Census data. In 2010, for instance, Massachusetts lost a congressional seat (from 10 seats to 9), while Florida gained two (25 to 27).
- State Legislatures. Seats are drawn for state legislative and senatorial districts using Census data.
- Local Government. Cities and towns use Census data to draw internal political boundaries (i.e., wards and districts).
The government uses Census data to inform funding decisions.
The richness of Census data allows the federal government to distribute funding for some of the country’s most critical social programs directly toward those people with greatest need (more on these programs in Part 3). Most Census-guided funding to Massachusetts is allocated through one of the three systems below (other approaches also exist, but these are by far the most common):
- Formula Grants. Formula grants are allocated to states in accordance with formulas that typically target greater funding to areas or populations with greater need. The largest example of this type is Medicaid, which provides health insurance coverage to low-income families and individuals.
- Project Grants. Unlike formula grants, project grants fund specific projects for fixed periods of time. These can include anything from scholarship funding to construction grants. The Head Start/Early Head Start programs are examples of this type of grant.
- Direct Payments for Specified Use. Direct payments are made to individuals, private firms or institutions for a particular activity or in support of a particular program. The Supplemental Nutrition Assistance Program (colloquially known as SNAP or “food stamps”), is one such program.
Researchers of all types use a variety of Census Bureau products to understand our communities.
In addition to the decennial Census, researchers make use of another Census Bureau product—the American Community Survey (ACS)—to understand the makeup of America. From 1970 to 2000, the decennial Census included two questionnaires. The first, the short-form Census, was distributed to almost every household in America. The second was the long-form Census, which was distributed to the remaining one in six American residences that did not receive the short-form.
More complex and time consuming, the long-form Census gave researchers a more nuanced understanding of the population than the short-form. It did so by asking more questions of a representative sample of the population and extrapolating those answers across the United States as a whole. The long-form Census included questions about languages spoken at home, as well as educational and employment situations (among other areas).
The 2000 Census was the last decennial Census to feature a long-form questionnaire. In 2005, those questions were moved over to its replacement, the ACS. Administered annually, the ACS allows fine grained analysis of all Census-designated geographies, from the nation as a whole down to geographies as small as several city blocks.
Together, the ACS and decennial Census are used all over the country to understand a changing America. State and local governments use the Bureau’s data to help plan for population growth, deciding where to build transit lines and more. Businesses use it to understand their local markets and to consider plans for expansion. In the nonprofit world, Census data are used to identify vulnerable populations for assistance, while social scientists and pollsters use Census data to design sample methodology to better understand what the American public is thinking. All told, Census data uses are myriad.
Part 2 – What Areas in Boston and Massachusetts Are the Hardest to Count?
IDENTIFYING HARD TO COUNT TRACTS
Using a metric outlined by researchers at the City University of New York (CUNY), groups working to improve Census response often focus outreach efforts on the one-fifth of Census tracts with the lowest initial mail return rates nationwide (less than or equal to a 73 percent return rate).2 People who are less likely to return their Census forms include those who:
- Rent or move frequently
- Live in group quarters
- Live in non-family households (with unrelated friends or roommates)
- Distrust the government
- Don’t speak a more common language
- Have lower incomes or lower educational attainment
- Live in homes with non-standard addresses, like accessory dwelling units or very rural homes
A long history of unjust public policy decisions has disproportionately harmed communities of color, leading people of color to fall more often into one or more of the above categories. African Americans, for instance, are more likely to be low-income and to rent their homes rather than own them. And the Latino/a community may be especially distrustful of the current federal administration. In order to ensure that these communities don’t go underrepresented in the coming years, local efforts to get out the count require an understanding of which parts of the state have greater shares of people in the above categories.
One quarter of all tracts in Massachusetts are hard to count.
Massachusetts’ hard to count (HTC) tracts tend to be urban or suburban rather than rural (Figure 1). These tracts are often made up of populations with lower incomes and educational attainment levels. All told, about 23 percent of the state’s population lives in HTC tracts. Massachusetts
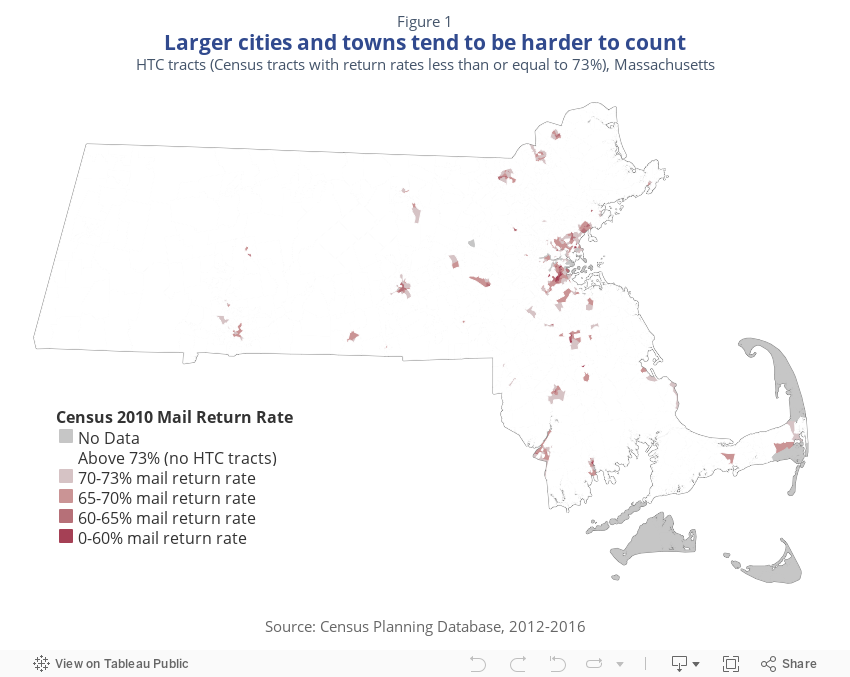
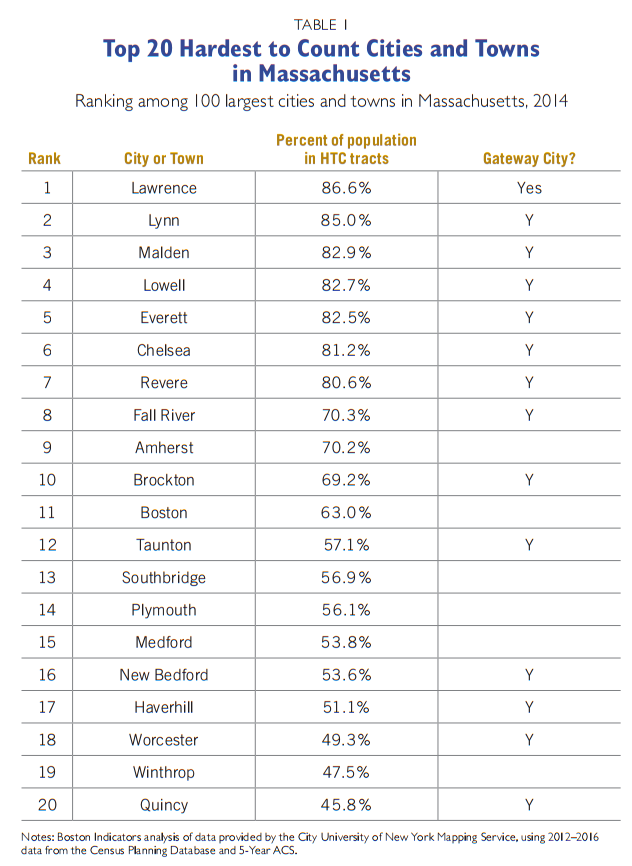
Many of these HTC tracts are located in the state’s 26 Gateway Cities—a designation used by the state to target cities for additional financial resources (Table 1). The state defines Gateway Cities as communities with populations between 35,000 and 250,000 people and with educational attainment rates and incomes lower than state averages. In response to the challenges posed by counting these Gateway Cities, past and future Census get out the count organizing—such as canvassing and targeted advertising in ethnic media—focuses on these urban areas.
Where are Boston’s hard to count tracts, and why do we have so many of them?
Though not the hardest to count city by population percentage, Boston has by far the largest total number of people living in HTC tracts (almost 415,000 people in 2014). Boston’s HTC tracts are concentrated in the neighborhoods of Dorchester, Roxbury and East Boston. Further, roughly 10 percent of the city’s total population lives in tracts with a return rate of less than 60 percent–the hardest of all to count. As shown in the darkest shade below, these tracts are primarily in Dorchester and Roxbury. Boston
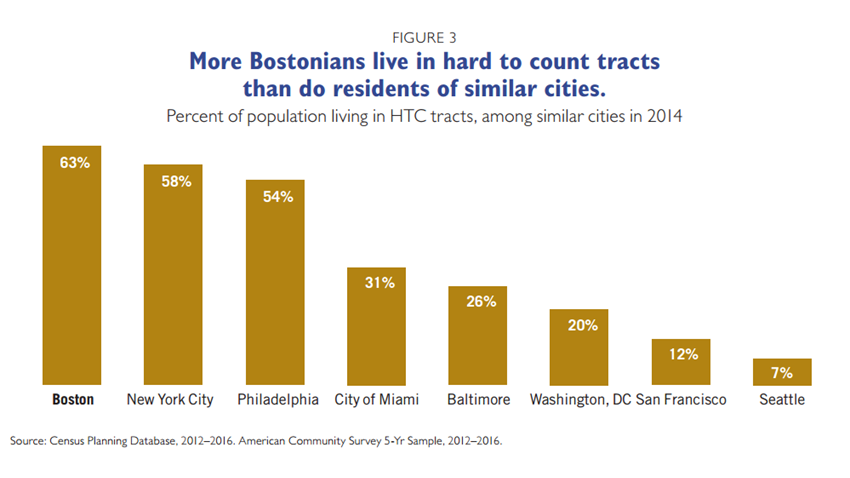
The percentage of Boston’s population that lives in HTC tracts makes it the ninth hardest to count city in the nation when measured against the 100 largest U.S. cities.3 But this nationwide comparison includes cities that are pretty different from Boston, including some that are much smaller. When comparing Boston to cities that are much more similar—in terms of size, racial composition and density—Boston ends up being the very hardest to count (Figure 3).
Boston is harder to count than these similar cities for three primary reasons:
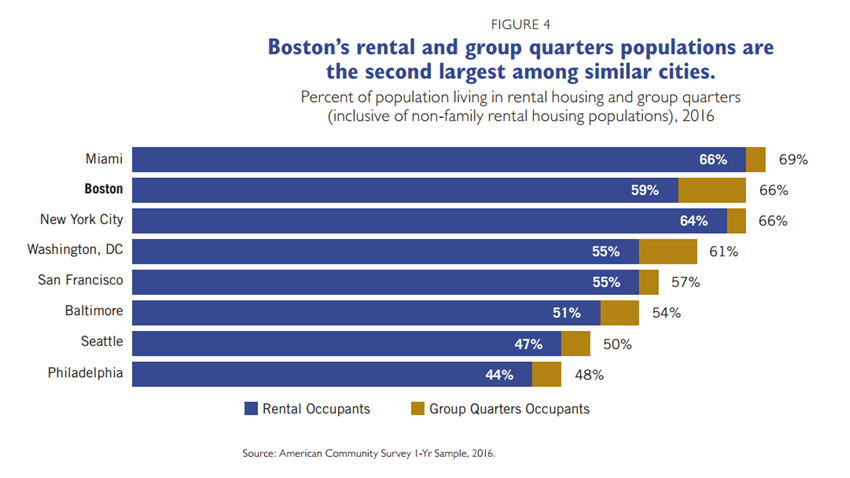
- Boston has a high share of renters. Because they are significantly more transient than homeowners, the Census Bureau has a harder time tracking rental address changes in real time. According to a 2010 return rate analysis conducted by the Census Bureau, only 67 percent of renters ultimately responded to the Census questionnaire, compared to 86 percent of homeowners. Almost two-thirds of people living in Boston are renters (59 percent). Only Miami and New York have higher shares of renters (see Figure 4).
- Boston has a high share of people living in group quarters. Group quarters are larger residential buildings managed by an external entity or organization, such as a college dorms, residential rehabilitation facilities, nursing homes and prisons. Sometimes people living in group quarters are double-counted (as in a college student being counted both in a dormitory and at their permanent residence) and other times they are missed entirely (such as an individual never receiving or returning a questionnaire). These problems become more pronounced with larger group quarters. Boston’s larger share of people living in group quarters is largely due to the city’s high student population, which led every similar metro at 16 percent. Many of these students live in on-campus dormitories, making up 5.6 percent of the city’s overall population.4 Outside of group quarters, 18–24 year-olds have the second lowest Census return rates across age cohorts, at 55 percent.
- Boston has a high share of non-family households with three or more people living together. With 4.6 percent of Boston’s households containing three or more non-family residents, Boston trails only San Francisco (5.1 percent) on this metric. For households of this size, respondents have historically exhibited some confusion about how to include roommates, boarders or other less formal residents when completing the Census form. This confusion may also explain why return rates decrease as non-family households increase in size. In 2010, 84 percent of two-person households returned their Census questionnaire, while three-person households returned 78 percent of theirs.
Taken together, two-thirds of Bostonians rent their homes or live in group quarters (Figure 4). These residents tend to be lower income, people of color or both; and were undercounted in Census 2010.5 They are at risk of being missed again in Census 2020.
As a large, diverse city, Boston also has other types of residents who are less likely to return their Census forms. While Boston’s share of these people isn’t higher than that of similar cities included in this analysis, it nevertheless contributes to Boston’s HTC status. These groups include:
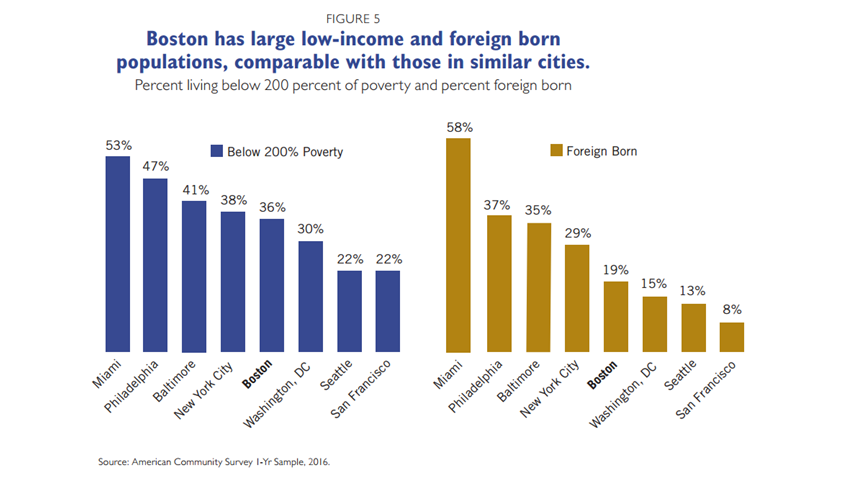
- People who distrust the government and/or don’t speak one of the more common languages. Fears (of deportation, etc.) and language barriers can limit Census participation. These fears are particularly prevalent in today’s political climate, and among many of the nation’s foreign born populations. Though not as large as some similar cities, Boston’s foreign born population is still substantial and potentially prone to these fears (Figure 5).
- People with lower incomes or lower educational attainment. Poverty status is often an important signifier of whether someone will respond to the Census. For Census 2000, 64 percent of low-income individuals nationwide returned their Census documents—around 14 percentage points lower than the overall return rate of 78 percent. While Bostonians are often in better financial situations than residents in similar cities, the 36 percent of Bostonians at or below 200 percent of poverty—the poor and very poor—may require special efforts to reach in 2020 (Figure 5).
Part 3 - How Do Census Counts Affect Federal Funding to Massachusetts?
An accurate state and local Census 2020 count for Massachusetts will help ensure that the more than $16 billion in federal support for important social programs—health care, housing, food and nutrition programs and more—goes to those intended. Census counts affect funding distributions for federal programs in a variety of different ways. Some programs, like Title 1 funding for low-income schools, are affected by Census counts both at the state and local levels. States with more low-income students receive more total federal funding and then states allocate this funding to districts and schools based on their relative shares of low-income students.
Other programs may hardly be affected at all by Census counts. For instance, even though Medicaid is the largest Census-guided program in Massachusetts, the state’s disbursement is pretty insulated from an undercount. The Medicaid formula (FMAP) relies on the per capita income of a given state, and when per capita income is sufficiently high, as it is in Massachusetts, the federal government splits Medicaid costs 50-50 with the state. The rate of 50-50 is set as a floor below which this ratio cannot go. For Massachusetts, which is one of 14 states already at 50-50, the federal reimbursement rate can’t go any lower. Conversely, Census counts really do affect Medicaid funding in states with lower per capita incomes and, therefore, higher reimbursement ratios (the maximum possible reimbursement ratio is 83 to 17).
The following tables detail the different major types of Census-guided funding coming to Massachusetts, and identify where an undercount might affect future funding levels. In constructing these tables, we rely heavily on two reports: Why the Count Counts from the Massachusetts Budget and Policy Center and Counting for Dollars 2020, Massachusetts from George Washington University’s Institute of Public Policy (sourced below as “MB” and “GW” respectively).
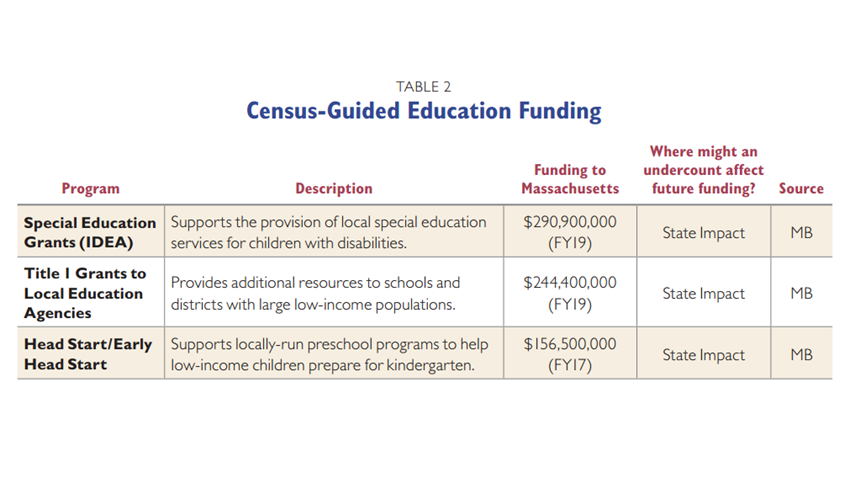
EDUCATION
Although Massachusetts relies more heavily on state and local funding than many other states to fund its school systems, federal dollars nevertheless provide important supplements to the state’s education spending. Because a large portion of Census-guided education funding is needs-based, local counts of 5–17 year-old children in poverty are especially important.
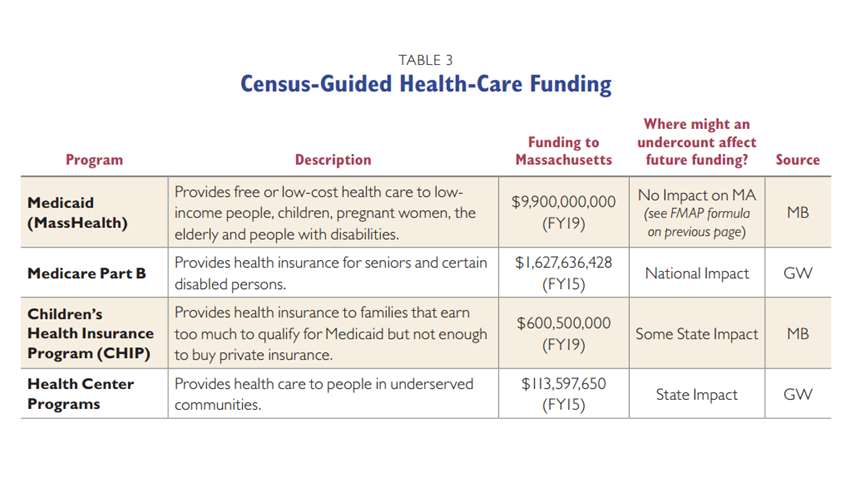
HEALTH CARE
While state Medicaid funding would not be reduced by a 2020 undercount, there are other ways by which Massachusetts Census counts affect federal health-care funding. Health Center Program funding relies on the number of eligible families in the area, and child population counts govern portions of Children’s Health Insurance Program (CHIP) funding. Massachusetts’s population counts also contribute to national reimbursement rate determinations for Medicare Part B.
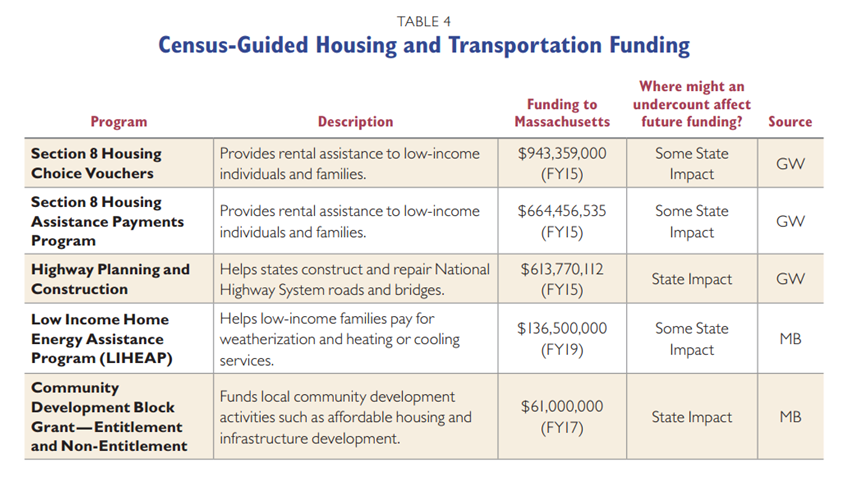
HOUSING AND TRANSPORTATION
Section 8 housing supports are some of the largest sources of housing and transportation related funding for Massachusetts, with a total disbursement of $1.6 billion to the state in FY2015. Apart from these programs, Census data helps guide funding for the state to highway planning and construction projects, and it factors into the distribution of Low Income Home Energy Assistance Program (LIHEAP) funding.
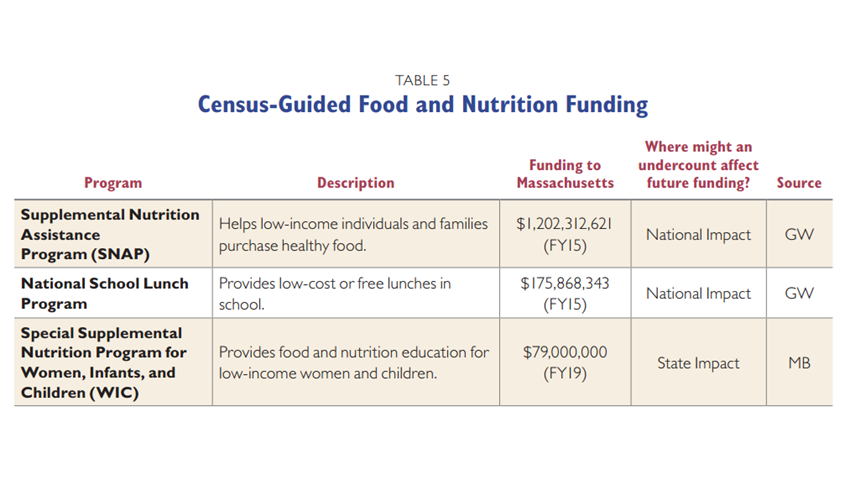
FOOD AND NUTRITION
Food assistance programs in Massachusetts provide essential support to thousands of the state’s food insecure families. Compared with the nation as a whole, Massachusetts has an especially large share of families with elderly or disabled members who receive food assistance—46 percent of Supplemental Nutrition Assistance Program (SNAP) recipients in Massachusetts are elderly or disabled compared with 31 percent nationwide. Because SNAP functions as an entitlement for any eligible individual or family at a given time, Census counts don’t directly affect state-level SNAP funding. But Census counts do help determine total funding at the national level, which is then distributed out to states. Census data more directly affect the Special Supplemental Nutrition Program for Women, Infants, and Children (WIC) with each state granted support based on its share of eligible individuals.
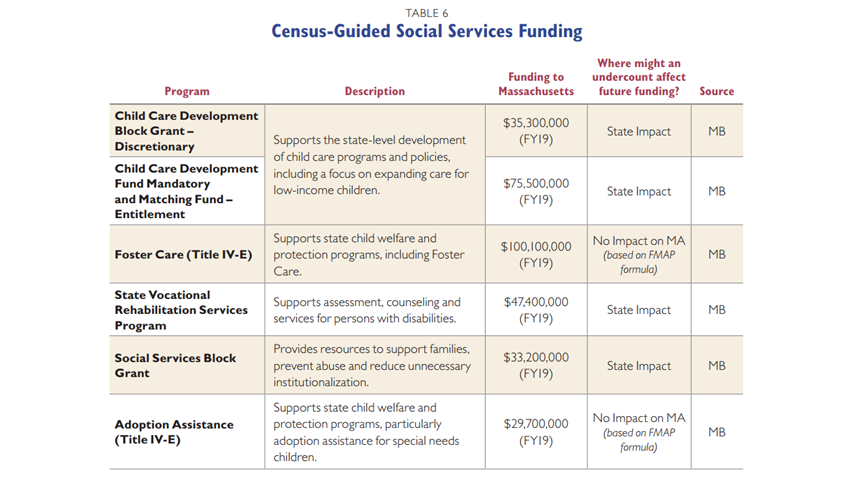
SOCIAL SERVICES FUNDING
Supportive programs that are focused on child and family assistance fall under a general umbrella of “Social Services.” These programs include a number of child-related programs and services such as Foster Care and Adoption Assistance, as well as programs supporting those with disabilities like State Vocational Rehab.
Part 4 - What Are the Emerging Issues of Census 2020?
CENSUS FUNDING
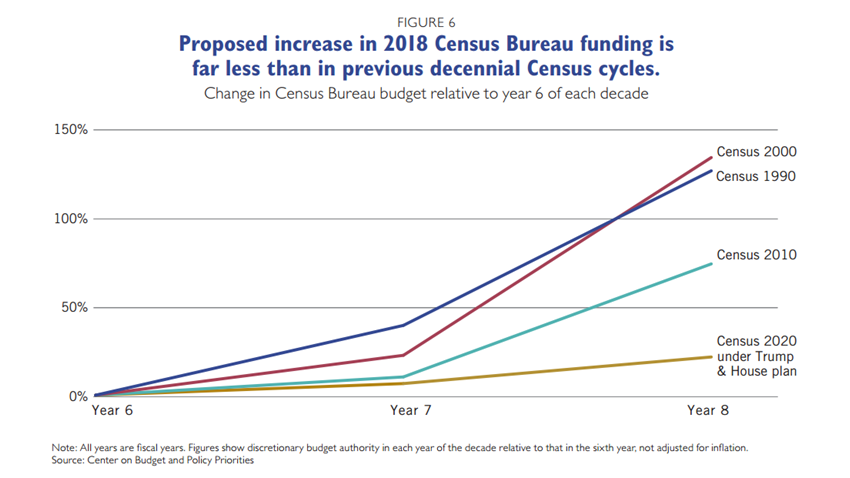
The Census is one of the largest and most expensive undertakings in the United States. According to the Government Accountability Office, the 2020 Census is also one highly at risk of not meeting its funding goals. Funding for the Census Bureau tends to be cyclical across a standard 10-year pattern. Funding drops significantly right after a Census year and then, as preparations ramp up several years later for the next decennial Census, funding ramps up again. Therefore, the best way to analyze Census funding is to compare it to similar points in previous 10-year cycles, as we do in Figure 6. For the last several years, Census 2020 funding has lagged that of the last three Census cycles, often by considerable margins.
Funding is a constant concern for the Census Bureau. Though the FY2018 budget process is complete, with Census 2020 receiving $2.81 billion out of the omnibus appropriations bill ($1.13 billion more than the administration’s revised request), the Senate and House must now appropriate funds for the FY2019 Census budget. As of publication, these two chambers have proposed very different funding levels: The Senate has proposed $4.2 billion for FY19 and the House has proposed $3.4 billion (both use some of FY18’s budgeted Census funding for FY19).6 Even at these sums, underfunding the Census Bureau is a real worry for FY19 if the Bureau’s request of $3.8 billion is not met. As a result, advocates remain concerned that Census funding could still fall below what is needed to ensure an accurate count.
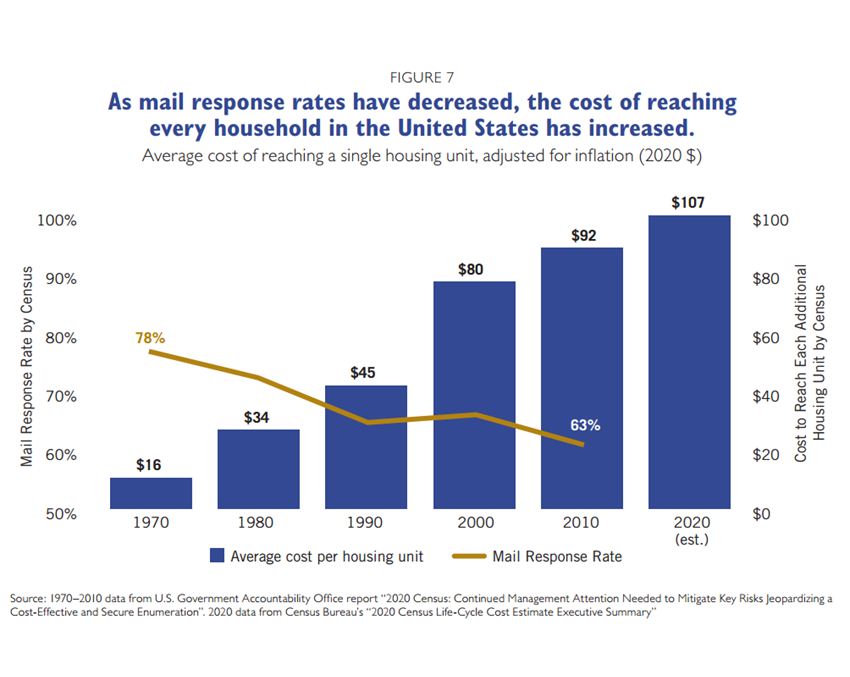
It’s not just that Census 2020 is below funding levels of previous cycles, either. Several factors unique to this particular cycle mean it’s likely that the Census Bureau will require greater funding than in previous cycles: The U.S. population has grown over the last decade, the Census is using a new internet approach for the first time, and response rates to initial mailers have been declining over the past several decennial cycles. The Census Bureau requires greater resources to conduct in-person outreach to households that do not respond to initial Census mailers. Researchers across disciplines, not just those working on the Census, are finding it harder and harder to reach potential respondents. Unfortunately, it’s not entirely clear why this is happening. Leading theories include increased confidentiality concerns and increasing numbers of two-worker households. For the Census Bureau, canvassers must be sent to more non-responsive households in an attempt to get them to fill out the Census. As a result of these factors, the Government Accountability Office (GAO), projects the 2020 Census to cost roughly $107 per housing unit—a 16 percent increase over Census 2010’s cost per housing unit (Figure 7).
Funding problems have plagued Census 2020 prep work.
Funding concerns have had a very real impact on Census 2020 preparations. Due to the lack of funds, work to ensure an accurate count has been cancelled or delayed.
- The creation of a comprehensive communications and outreach plan was delayed.
- There have been a number of cancelled process tests, including:
- Data collection and question wording tests for American Indian enrollment;
- A canvass and data collection methods test in Puerto Rico;
- Two full end-to-end tests, which would have tested Census procedures from start to finish.
- The sole remaining end-to-end test took place in Providence County, Rhode Island, in mid-summer, 2018. There, the Census Bureau ran a full trial Census program, including distribution and field data collection components that mimicked Census 2020 (the “end-to-end test”). The end-to-end test of Providence County was much reduced in size and scope as compared with the similar 2010 “dress rehearsals,” which focused on two urban centers and an additional nine suburban and rural mixed counties.
PROPOSED AND ALTERED QUESTIONS FOR 2020
Each decennial Census mostly asks questions that have been asked for decades, but the Census Bureau often makes some changes to better understand the American populace. With a more nuanced understanding, people that could have fallen through the cracks are more likely to get the attention, representation and support they deserve. For Census 2020, most of these changes revolve around efforts to better understand the racial and ethnic makeup of the country, as well as LGBTQ relationships.
Race and ethnicity question revisions will generate slightly more detailed responses.
Since 1970, the Census has asked about race and ethnicity through two separate questions. The first asks whether an individual is of Hispanic origin, and if so, of what ethnicity (Puerto Rican, Cuban, etc.). It then moves to the race question, asking whether an individual is White, Black, American Indian or Alaska Native, Asian, or Some Other Race. Thus, someone from Puerto Rico might answer both Hispanic of Puerto Rican origin (ethnicity) and White (race).
After Census 2010, the Bureau considered two significant revisions to this approach, both of which were not ultimately adopted for Census 2020: 1) removing the ethnicity question entirely and instead adding “Hispanic or Latino” as an option alongside the racial choices of “White,” “Black,” “Asian,” etc.; and 2) adding “Middle Eastern or North African,” (MENA), as an option for answering the race question.
While neither of these significant revisions will be incorporated into Census 2020, the Bureau is making a couple of smaller revisions to the race question to help generate more detail on the origins of White and Black or African American respondents. The “White” racial identifier will include an open response box for origin, with suggestions including German, Irish, English, Italian, Lebanese and Egyptian. Likewise, “Black or African American,” will include an open response box for origin, with suggestions including African American, Jamaican, Haitian, Nigerian, Ethiopian and Somali.
A revision to the household question will generate slightly more detailed information on same sex households.
In 1990, changes to the Census allowed for the identification of same sex couples living together in a household for the first time. To do this, researchers look at married or unmarried partners within a household who are of the same sex.
However, this approach is limited in that it only really allows researchers to identify same-sex couples who are living together, as opposed to all individuals who might identify as Lesbian, Gay, Bisexual, Transgender or Queer. In response to these current data limitations, some advocacy groups requested the addition of question(s) that would directly ask for information on sexual orientation and gender identity. Though it was briefly considered by the Census Bureau, the request was ultimately denied.
Nevertheless, recognizing that same sex households are currently enumerated through inference, the Bureau has altered Census 2020 to formalize the practice of capturing same sex household data. The Census will now include separate options regarding relationships within a household to distinguish between “same-sex” and “opposite-sex” couples.
The Census 2020 citizenship question will most likely stand, despite challenges.
In 2018, the Census Bureau skipped the traditional process for carefully vetting proposals for new questions, and added a question about citizenship status directly to the Census. Adding such a question could have the troubling effect of depressing response rates. The question is one that’s currently asked through the American Community Survey but only of a small subset of Americans.7 This change immediately brought court challenges by a number of Attorneys General. As the case has proceeded, new information about the Bureau’s decision-making has come to light.
When these changes were first proposed in 2017, leadership at the Census Bureau’s home at the Department of Commerce claimed that the question was added at the request of the Department of Justice (DOJ). They argued that the citizenship question was necessary for proper enforcement of Section 2 of the Voting Rights Act (ensuring communities can elect their preferred representatives in minority communities that may contain many non-citizens). New documents suggest that this was not the case, as it was the Secretary of Commerce who first proposed the change, not the DOJ. Interest groups opposed to legal and political representation for non-citizens had been lobbying the Department of Commerce to add a citizenship question for some time, and the recently released documents suggest a close connection between these lobbying efforts and the Department of Commerce’s decision to include the question.
The Department of Commerce has good reason to believe the citizenship question will depress response. In a report presented at its own National Advisory Committee on Racial, Ethnic and Other Populations fall meeting, researchers reported an increase in confidentiality concerns during tests of other Census 2020 processes. Respondents feared having their information passed on to the Department of Homeland Security or Immigration and Customs Enforcement. They also provided incomplete or incorrect information to interviewers, and tried to break off or walk out of interviews. In one of the more extreme cases, an interviewer returned to a Hispanic community after dropping off interview literature, and found one of the potential respondents moving due to a fear of being deported. In the above instances, respondents were paid for their time, and were walked through the different tests by interviewers who explained the ways individual responses are legally protected. Yet, respondents still had concerns. A true Census, where the Bureau must rely on self-response, may have even greater difficulty generating responses from non-citizens. When testifying about the change before Congress, the Secretary of Commerce estimated that such a question could require Census canvassers to revisit an additional 630,000 households to ensure a complete Census, with potentially significant cost implications.
It is for these reasons that the citizenship question has become a focus for critics. From former Census directors to lawmakers and a number of Attorneys General, many believe that a citizenship question will hamper the ability of the Census to get an accurate count, and they are taking efforts to remove it.
TECHNOLOGY AND THE CENSUS
In an effort to create efficiencies and make it easier for some people to complete the questionnaire, Census 2020 is the first decennial Census planned to take place entirely online (neighborhoods with lower internet usage or high percentages of older populations will likely still receive paper forms). To prepare for the count, the Bureau is using governmental and non-governmental databases to see where Americans are living. The Bureau estimates that this method of gathering addresses will completely cover roughly 70 percent of residences in the United States, leaving just 30 percent for in-person address canvassing verification. The Bureau has acknowledged that there is a high degree of risk associated with this change and is working to mitigate it through extensive communication with stakeholders from which the Bureau is pulling address data.
In addition to using large databases to target the count, the Bureau will make use of other online tools and platforms to micro-target advertising to respondents. As an example, people who haven’t responded to Census outreach efforts through traditional advertising (such as on TV or radio) may begin seeing ads on Facebook or Twitter, linking them directly to a multilingual Census form.
Census 2020 has plans to protect respondent data.
There are two levels of security features for Census data: 1) legal security; and, 2) software and hardware security.
Strict legal safeguards inhibit data sharing.
During World War II the federal government obtained names and addresses from the U.S. Census Bureau for the purposes of identifying and interning Japanese Americans. After the war, and in opposition to the broad authority over Census data that was granted to the U.S. government from 1942 to 1947, the U.S. Congress passed Title 13 of the United States Code of Laws.8 The Act made it illegal for anyone at the Bureau to divulge any identifying information collected during the Census. For more than 50 years since, the Bureau and anyone within it has been expressly prohibited from sharing any identifying data for any purpose. This information cannot be shared with private organizations, the media or with any governmental agencies (such as Immigration and Customs Enforcement). Even the courts are covered by Title 13, as personally identifiable information cannot be obtained even with a court order. Disregarding the law carries a heavy penalty, and has not occurred since its implementation in 1954. Violators of Title 13 would face a $250,000 fine, five years in prison, or both.
The first online Census presents challenges in software and hardware security.
As the first Census to be conducted primarily online, a robust software and hardware security system is necessary to ensure confidentiality of data and smooth operation of the Bureau's systems. To meet these goals, the Bureau is utilizing dozens of cybersecurity tools that are intended to protect respondent data while allowing the Census to remain easy to fill out.
Nevertheless, these security efforts can only go so far. While the Bureau may be capable of responding quickly to internal threats such as data breaches and compromised employee devices, for state and non-state actors who may be interested in making the count more difficult, there are multiple avenues to do so. Denial of service attacks can slow Census systems to a crawl, while flooding Census response sites with false data can throw off the count until the Bureau is able to discern real respondents from false ones.
Understandably then, the Bureau is treating cyber threats as a serious concern that could impact the success of the Census. The Bureau is further concerned that cyber threats—real or imagined—could result in failing public confidence in the Census, and ultimately, depress response rates. The Bureau and its partners are therefore spending billions to ensure that the technologies the Census will run on are ready for these upcoming cybersecurity and confidence threats. Despite these efforts, the Census remains behind schedule on the testing and approval of many of its IT systems. To address these delays, the Bureau has enacted an accelerated testing and approval schedule, which puts these systems on track for approval by the time Census 2020 goes live. Concerns remain, however, that even with this extra effort, the tight schedule may lead the Bureau to miss flaws in its systems.
Fundamentally though, Census data are protected by a complex web of legal and technological safeguards. Respondents should not worry about their data being used improperly—either by the administration or external actors.
ROLE OF NONPROFITS AND EXTERNAL ACTORS
The Census Bureau has often relied on outside support to ensure an accurate count, and there are a couple of ways organizations can assist the Bureau across the entire Census process. Up until April 2018, community organizations were allowed to submit address updates to the Bureau’s Master Address File (MAF). This is particularly useful for HTC areas, where on-the-ground organizations often find households the Bureau might otherwise miss.
During enumeration, local actors can supplement the canvass interviewers, and work to reassure vulnerable populations that the Census is safe to take. Organizations can also work to remind residents to respond to the Census itself, independent of any concerns about confidentiality.
Part 5 - How Are Local Get Out the Count Efforts Being Organized in Massachusetts?
The get out the count campaign is a time and resource intensive process that organizations across the country undertake every decade, in an effort to make sure that all Americans are counted. Massachusetts is fortunate to have an engaged philanthropic community working actively to achieve an accurate count. Serving as the go-to resource for Census related funding, the Massachusetts Census Equity Fund (MCEF) worked throughout the Census 2010 process on supporting get out the count efforts among its grantees, providing necessary funding and technical assistance to ensure grantees’ efforts would be successful. With MCEF support, Census 2010 grantees ran Census outreach, canvass operations and phone banks in hard to count (HTC) neighborhoods, improving the overall mail return rate in some and limiting a decline in others. With lessons learned from MCEF’s Census 2010 efforts, the Fund is working on a more comprehensive Census 2020 effort, focused on coordinating:
- A Learning Community to build a communication network and provide resources to educate partners across the Commonwealth on the importance of the Census and promote active involvement to ensure a fair and complete count in Massachusetts. This includes working with foundations, nonprofits and Census representatives as well as local, state and federal officials.
- A Grant Process that will target support for grassroots organizations coordinating education and outreach initiatives in HTC communities across the Commonwealth.
The Census Equity Fund’s 2020 efforts will occur in three phases from January 2018 through fall 2020.
PHASE 1: JANUARY 2018 - DECEMBER 2019
Phase one consists of the formation of a funders learning community, research, and planning for Census outreach.
The funders learning community came together in the summer of 2017 and will meet for the duration of the project. Primary activities will include raising funds to support a donor collaborative that will give grants to community-based organizations; holding quarterly funder forums and webinars to update the philanthropic community on developments with the Census process; and co-sponsoring forums and webinars with nonprofits, community-based organizations and associations to promote their involvement in the Census process.
The research and planning for the project will require identifying the HTC communities in the state; researching the challenges presented by a digital Census and strategizing solutions; determining the impact of the Census on distribution of revenues to the state; meeting with stakeholders and policy makers in order to support ongoing efforts and increase collaborations; public education on the importance and implications of the Census on Massachusetts; developing promotional materials; and planning for a media launch.
PHASE 2: JANUARY 2019 - DECEMBER 2019
Phase two involves ongoing education and promotion about the Census as well as the launch of a grant allocation process to fund grassroots and civic engagement organizations to educate, collaborate and engage with the Census.
The fund will implement a statewide communications and public education strategy to effectively work with policy makers, the nonprofit community, the media, the public and the private sector on Census 2020 and its impact to the Commonwealth.
In the fall of 2018 the fund will convene civic engagement organizations to gather information to inform the grant-making process. The fund will also distribute an online survey to reach more organizations that are working on the ground in HTC communities. The goal of these efforts is to ensure that the grant-making process is informed and reflective of the needs of the grassroots community. A Request for Proposals will be released in January 2019 for Census planning, education and get out the count funding. Grants will be awarded by April 2019, one year prior to the Census deadline. The fund will communicate with grantees on an ongoing basis, to ensure they receive relevant updates from the Census Bureau and from each other, and have access to Census hosted trainings regarding access, education and information about the Census.
Through 2019 and in to the early months of 2020 the fund will maintain resources for supplemental or additional grant needs that arise due to new information, changes with the Census or realities we learn about in the Commonwealth’s HTC communities. These grants will require the same level of application, review and collaboration as the annual grants that will be awarded in April 2019.
PHASE 3: DECEMBER 2019 - FALL 2020
Phase three involves ongoing community education, grantee support and possible additional grants to increase the response rate in HTC communities and achieve an equitable Census count.
The work of grantee organizations will be in full swing between April 2019 and May 2020. The grantees will be engaging in a variety of efforts including sponsoring public education events; distributing and displaying Census information onsite; managing challenges presented by a digital Census; assisting people in completing and returning their Census forms; and promoting the Census in diverse media markets. Collaborations and new strategies will be explored to ensure community engagement efforts are successful and that those populations at risk of being undercounted are protected and engaged.
Appendix A - How Does the Census Count People?
The decennial Census count is a three-step process: 1) establish where to count; 2) motivate people to respond; and 3) check for accuracy.
ESTABLISH WHERE TO COUNT
Before beginning the Census, the Bureau first establishes where the count will occur—that is, where people are actually living. Between each 10-year cycle, housing situations change. Buildings that were single residences in the previous Census may have become condos. Pastures or forest may have become subdivisions, and subdivisions may have become commercial centers. Understanding these changes, and how they’ve changed where people live, is paramount to an accurate Census.
MOTIVATE PEOPLE TO RESPOND
Simply distributing the Census questionnaire to every residence in America is not an effective means of getting an accurate count, as over time response rates have declined significantly. In 1970, the mail response rate was 78 percent, falling to 63 percent mail response rate in 2010 (Figure 7).
To address the problem of declining responses, in 2010 the Bureau partnered with 250,000 organizations to help get out the count. These partnerships ranged from governments to nonprofits to for-profit businesses, and included everyone from churches to sororities. In addition to outreach performed by its partners, the Census Bureau ran commercials on television and in print in order to encourage individuals to send in their completed form. For 2020 the Bureau will expand advertising to social media and internet websites.
CHECK FOR ACCURACY
One of the biggest concerns for any Census Bureau statistician is the accuracy of enumeration. To evaluate this, the Bureau has run something called a “post-enumeration survey,” for every decennial Census since 1980. These surveys send canvassers back to a representative sample of Census-designated block groups across the whole of the United States. Canvassers are tasked with finding out all the information that the Census may have missed—whether or not residents moved after they returned the census, if they spent more time at a second residence than the one where they were counted, or even if they were missed entirely. The Census Coverage Measurement (CCM)—2010’s post-enumeration survey—was tasked specifically with obtaining a more precise measurement of populations that are hard to count. At the national and state level, the CCM is believed to be a more accurate measurement of the population than the Census. At smaller geographies however, the Census has significantly less measurement error and is likely to be more accurate.
Critically, CCM findings are not used to adjust Census counts. The CCM is instead used to measure Census error, the degree to which the Census overcounted or undercounted the U.S. population.
Post-Census, analyze whether populations or regions were undercounted.
An undercount is a type of analysis that allows the Bureau to understand what percent of the United States population the Census may have missed during enumeration. It is defined as when the Census Coverage Measurement shows a population to be larger than what the initial Census results show (CCM-Census=>0). In 2010, undercounts were particularly prevalent among communities of color and mobile populations. Nationally, the CCM saw a net undercount of:
- 2.1% for African Americans;
- 1.5% for Hispanic or Latino people;
- 1.6% for those answering Some Other Race; and
- 1.1% for renters.
While the CCM is most frequently used to identify the undercount, it’s not the only accuracy measurement tool at the Bureau’s disposal. In 2010, the Census questionnaire included a Coverage Follow-Up (CFU) question that was used to understand whether a household might be misreporting its residents. Once these potential households were identified, canvassers returned to the residence in person, and reported any corrections back to the Bureau. Knowing that the undercounting of young children was a significant problem in previous Censuses, one specific use of the 2010 CFU was to identify whether or not a household had properly counted its young children (between 0 and 4 years old). Post-Census, it became clear that the undercount of young children was indeed a concern. As a result of the follow-up process begun with the CFU, tens of thousands of young children were added back to the Census.
Analyze whether populations were overcounted.
When the Census Coverage Measurement suggests a population is smaller than the Census’ results show, an overcount results (CCM-Census=<0). Though some populations in Census 2010 were undercounted, on the whole the United States actually had a net overcount of 0.01 percent—or around 36,000 people. The most frequently overcounted population was non-Hispanic whites, by 0.8 percent.
Appendix B - What Questions Are on the Census and How Have They Changed?
The first Census, conducted in 1790, reflected the realities of the era: Slavery was widespread and elected officials were focused on understanding the industrial and military potential of the young country. This first Census collected only six data points:
- The name of the head of the family
- The number of free white males of 16 years and upward
- The number of free white males under 16 years
- The number of free white females
- The number of all other free persons
- The number of slaves
The 22 Censuses conducted every 10 years since then have evolved significantly over time. Questions on economic data were added in 1810, while questions on “social statistics”—issues like taxes, crime and mortality—were introduced in 1850. To more fully gauge the impacts of the Great Depression, statistical sampling was introduced in 1940. As a predecessor to the long-form Census, the statistical sampling pioneered here allowed the Bureau to ask more questions of fewer people, in order to obtain a broader understanding of how the American populace reacted to the Great Depression. The Bureau used these responses to understand where Americans moved, their economic state and more. Over time, the Census questionnaire has grown and shrunk, with one of the most significant changes coming with the implementation of the American Community Survey in 2005. Since then, Census questions have focused largely on basic demographic characteristics. As of publication, there are 12 planned questions for Census 2020:
- How many people were living or staying in this house, apartment, or mobile home on April 1, 2020?
- Were there any additional people staying here on April 1, 2020 that you did not include in Question 1?
- Is this house, apartment, or mobile home – (owned, rented, occupied without payment of rent)?
- What is your telephone number?
- What is Person 1’s name?
- How is this person related to Person 1 (asked of additional residents)?
- What is this person’s sex?
- What is this person’s age and what is this person’s date of birth?
- Is this person of Hispanic, Latino, or Spanish origin?
- What is this person’s race?
- Does this person usually live or stay somewhere else?
- Is this person a citizen of the United States?
Footnotes
- Source: Data provided by City University of New York Mapping Service at the Center for Urban Research, available at www.censushardtocountmaps2020.us
- While a 73 percent return rate may seem high, the Bureau calculates this rate through dividing returns by occupied units in an area (returns/occupied units in a given area). Another measurement, the mail response rate is calculated by dividing returns over all units in an area that were mailed Census questionnaires (returns/occupied + vacant units). This measurement is lower than the return rate, as the denominator is larger. Using the return rate, and focusing on occupied housing units, is therefore an effective means of understanding whether or not residents are missed during the Census.
- Source: Data provided by City University of New York Mapping Service at the Center for Urban Research, available at www.censushardtocountmaps2020.us
- Source: “Chapter 5, Housing Boston’s Students.” Housing a Changing City: Boston 2030. Available at: https://www.boston.gov/sites/default/files/boston2030_chapter_5_housing_bostons_students.pdf
- See Appendix A.
- Analysis performed by Terri Ann Lowenthal and retrieved from The Census Project - https://theCensusproject.org/2018/07/12/update-on-fy-2019-Census-bureau-budget-action-so-far/
- The ACS and 2020 Census citizenship question asks: “Is this person a citizen of the United States?” Respondents are given five response options: 1) “Yes, born in the United States,” 2) “Yes, born in Puerto Rico, Guam, the U.S. Virgin Islands, or Northern Marianas,” 3) “Yes, born abroad of U.S. citizen parent or parents,” 4) “Yes, U.S. citizen by naturalization” (including a box to input year of naturalization), and finally, 5) “No, not a U.S. citizen.”
- Full title of the Act: “An Act to Revise, Codify, and Enact into Law Title 13, U.S.C.” Available here: https://www.gpo.gov/fdsys/pkg/USCODE-2007-title13/pdf/USCODE-2007-title13.pdf