A Profile of Unemployed Workers in Massachusetts
By Peter Ciurczak
October 29, 2020
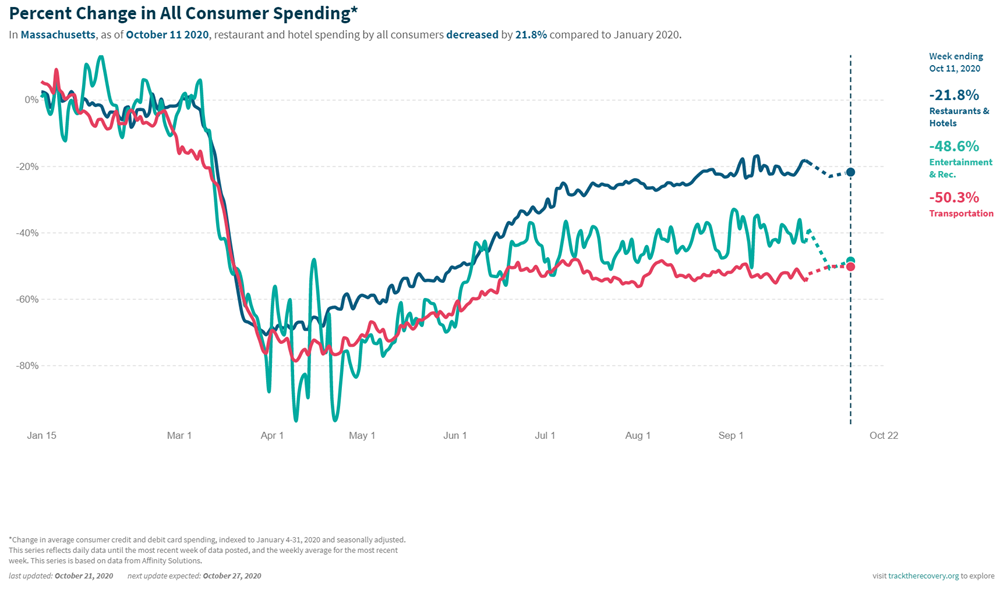
In part due to the federal government’s inadequate pandemic response, Massachusetts took the necessary step in early March of shutting down large swaths of society to gain control over COVID’s spread. The related economic shutdown caused a rapid decline in consumer demand that lasted through the end of summer. Only by early fall has spending returned to pre-pandemic levels, buoyed by retail and grocery sales. Nevertheless, spending at restaurants, entertainment venues and travel remains at least 20 percent below pre-pandemic levels.
With many fewer customers, Massachusetts businesses—especially smaller ones with less flexibility to weather hard times—found it difficult to justify reopening or retaining their workforce. This all has led to the troubling job cuts we’ve seen over the last seven months.
Comparing job losses across the most recent recession helps put our state’s current job losses in context. At the height of the Great Recession, Massachusetts lost around 140,000 jobs relative to its pre-recession employment peak. By contrast, the state lost over 690,000 jobs relative to the state’s immediate pre-pandemic peak by April 2020—almost five times more than at the Great Recession’s worst point. Despite some meaningful recovery, on net Massachusetts job losses during the pandemic are still more than two times greater than during the Great Recession.
These job losses have resulted in a big increase to our official unemployment rate. Unemployment in Massachusetts was lower than the national rate for every month going back to 2007. But by June, not only had unemployment jumped nationwide, but the Massachusetts rate had become the very highest state unemployment rate, at 17.7 percent. Unemployment has declined in recent months, and while the gap has shrunk, as of September our state rate remained almost two percentage points higher than the national rate.
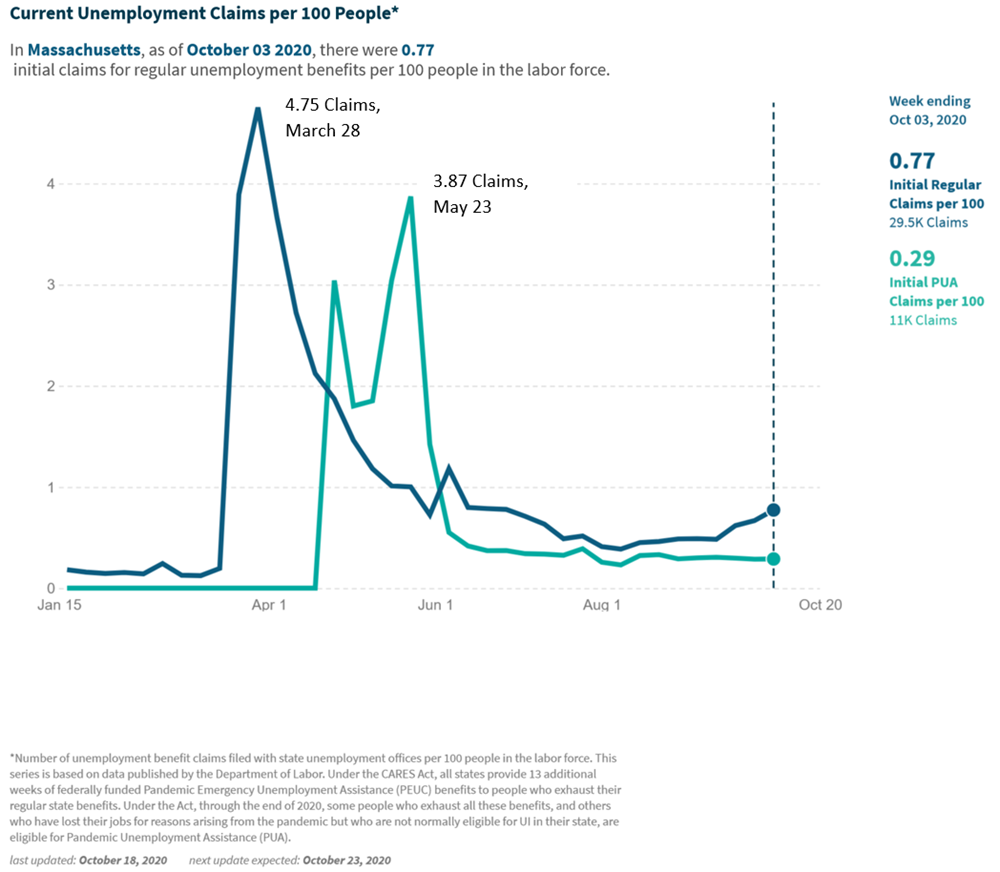
People out of work during the pandemic have applied for support through two different programs: 1) the regular unemployment insurance program for traditional employees working at places like restaurants and hotels; and 2) the new Pandemic Unemployment Assistance program (PUA) that was created through the federal CARES act. The regular unemployment system is structured around employer contributions and funded in part through payroll taxes. This doesn’t capture contract workers, like Uber and Lyft drivers, who are not legally treated as “employees” of a company in the same way. As part of its pandemic recovery efforts, Congress recognized that many of these workers were out of work and in real need of financial support nonetheless, so it set up the separate new PUA program to provide support.
The graph from Opportunity Insights, below, plots claims for both programs in Massachusetts. Weekly unemployment claims spiked early in the pandemic, with almost five in 100 Massachusetts workers making an initial unemployment claim during the week of March 28. For the week ending May 23, nearly four in 100 workers ineligible for regular unemployment claimed these benefits. Though data for the Pandemic Unemployment Assistance program (PUA) should be taken with a grain of salt—claims can be double counted, and the state initially had a number of claims that later turned out to be fraudulent—the program has nevertheless proven to be a critical support for hundreds of thousands of Massachusetts workers who would not have otherwise been covered by the regular unemployment system.
Taken together, these job loss numbers show the magnitude of a recession’s impact on employment, but they do not allow a fine-grained analysis of who in fact has lost their job. Fortunately, the state’s regular unemployment system keeps track of demographic, industry and geographic information for every claimant. Using these data below we analyze which categories of workers have seen the greatest losses, with a focus on demographic group, industry and geography. It’s important to note that while these graphs show the disparate impact of job loss on groups like workers of color and women, these numbers still don’t tell the full story because the data does not include unemployed contract workers who are getting support through the new PUA program. Disaggregated data is unfortunately not available for PUA claims.
BLACK AND LATINX WORKERS
While official unemployment rates by race and geography are only available from the federal government quarterly, we can use state unemployment claims data to get a good sense of disparities by race and ethnicity. By dividing workers claiming unemployment over all workers employed or unemployed (specific to each demographic), it’s possible to show the pandemic’s relative impacts on different workers. Here, we show that Black and Latinx workers have been particularly hard hit by the pandemic, as compared to their White and Asian peers. Claimants in these groups make up around 14-15 percent of their respective working populations, significantly above their February share. Due to systemic inequities reaching back generations, Black workers are often the “first to be fired,” during recessions. Unfortunately, the COVID recession appears to be little different.
WOMEN
Women too, have borne the brunt of the pandemic. In many respects this speaks to overall inequities in job distributions. Women remain less likely to be hired into CEO or other high ranking positions, and remain more likely to leave the workforce to become caregivers to their children when childcare is difficult to find or afford.
LOWER-WAGE WORKERS
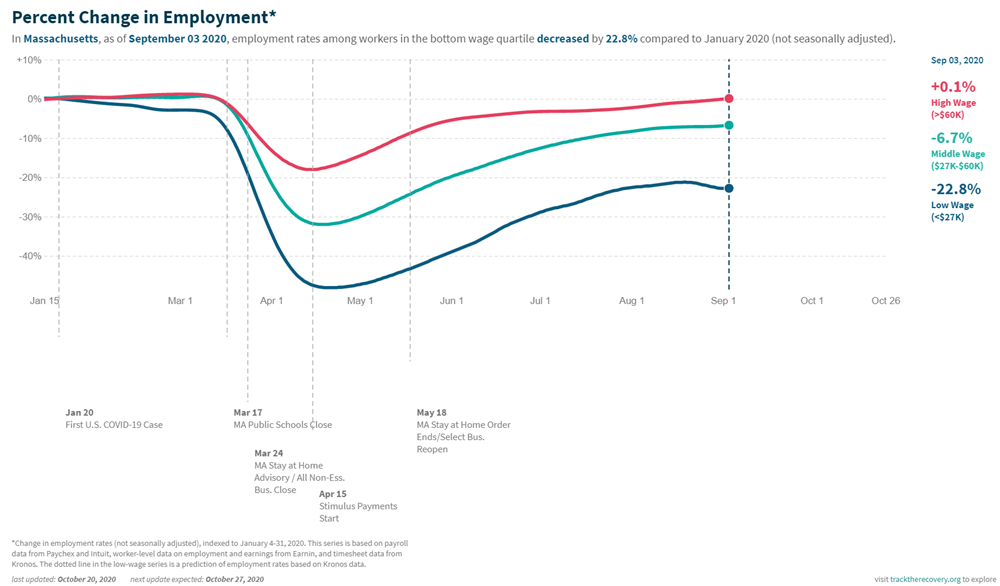
These graphs are two different ways of tracking pandemic impacts on lower-wage workers. Together, they show that these workers are far more likely to be laid off, furloughed, or otherwise unable to find work. Workers making less than $400, or $400 - $699 a week make up the largest share of unemployment claimants, with the lowest earners growing significantly between March and July.
Likewise, employment rates for workers at this level remain around 23 percent below their employment levels at the start of the year.
WORKERS WITHOUT A COLLEGE DEGREE
Workers without a college degree are filing for unemployment at more than three times the rate of degree holders. Nationally, workers with less educational attainment are doubly burdened, having largely not recovered from the Great Recession, even as workers with higher educational attainment saw a much smaller rise in unemployment over the current pandemic to date.
YOUNGER AND OLDER WORKERS
Workers aged 65 and over, and workers between the ages of 20 to 24 have been impacted by the pandemic for very different reasons. Older workers are less likely to be able to work from home than other cohorts, and those who continue to go into work find themselves caught between concerns for their health and concerns for their retirement. Older workers who were laid off earlier in the pandemic likewise face age discrimination as they attempt to return to work. Consequently, this is the first time since 1973 that older workers remain unemployed at higher rates than mid-career professionals—and in Massachusetts, they’re claiming unemployment at higher rates than any other cohort.
Young adults just entering the labor force during a recession face their own problems. They typically start in lower-level jobs, and see lasting negative impacts on their earnings and career prospects. They are also some of the first workers laid off. As a result, workers between 20 and 24 are claiming unemployment at the second highest rate of all workers.
SERVICE SECTOR WORKERS (AMONG MANY OTHERS)
Workers in food and accommodations, retail trade workers and health-care workers saw some of the most immediate job impacts as a result of the pandemic. Consequently, they are still struggling to return to their usual level of unemployment.
As many restaurants and other businesses remain closed or are operating at diminished capacity, projected tax revenue across the state has dropped precipitously. Without this revenue and without a new round of direct federal assistance, local governments have begun laying off staff, leading to slower, but still significant growth in unemployment claims among public administration workers since February. While managing to avoid the first jump in unemployment at the outset of the pandemic, these workers now have the sixth-highest number of jobless claims in Massachusetts.
Local unemployment rates across Massachusetts show where these populations are concentrated.
Unemployment rates across Massachusetts remain elevated. As shown in the interactive map above they are particularly high in cities with higher shares of lower-income and Black and Latinx workers. As a result, cities like Lawrence, Revere and Brockton have some of the highest unemployment rates in the state (20, 16 and 15 percent, respectively). By contrast, many of Massachusetts’ higher-income suburbs—such as Weston and Hingham—have relatively low unemployment rates (5.9 and 6.8 percent).
Pandemic-related shut downs caused a more immediate and deeper shock to employment in Massachusetts than did the Great Recession. If we make better progress at keeping the virus at bay, it is possible that we could also recover more quickly, but that path forward obviously remains far from certain. In recent weeks, for instance, the state has begun to see an uptick in its COVID positivity rate, threatening this recovery. As the pandemic’s ongoing impact remains uncertain, we will continue to provide new analysis of these employment trends through the COVID Community Data Lab.


