

Kids Today: Boston's Declining Child Population and its Effect on School Enrollment
INTRODUCTION
January 22, 2020

Diversity is core to what makes many cities vibrant, dynamic, adaptive and strong. Recently, Boston has gotten much more racially diverse, evolving from being only 20 percent people of color back in 1970 to 56 percent of color today. Boston is now 22 percent Black, 20 percent Latino and 9 percent Asian. Central to this growth in racial diversity has been our openness to a new global wave of immigration, with people coming from places like China, Brazil, the Dominican Republic and India. We also have diversity across industries, making our economy more flexible and resilient to unforeseen shifts in the national economy. Rather than having one dominant sector, we have large shares of people working in areas ranging from higher education to health care to technology to tourism and hospitality.
But there’s a way in which the rich tapestry of our city has eroded: We’re rapidly losing families with children. In particular, we’re losing families with K–12 school-aged kids. Even though our city’s total population has increased from a low point in 1980, we’ve actually lost school-aged population at the same time. And, if it weren’t for immigration, Boston’s school-aged population would have decreased even further.
Boston has experienced large declines among Black and white kids; significant Latino increases have offset some of these decreases, but only partially. The families who leave Boston when their kids approach kindergarten are predominantly middle and high income. Today, almost 8 in 10 students remaining in Boston’s public schools are low income (77 percent as of 2014) and almost 9 in 10 are students of color (87 percent as of 2019, almost half of whom are Latino). This has created a growing mismatch between the demographics of kids who attend Boston’s K–12 public schools and the city overall. The final section of this report looks at how evenly Boston is distributing the students who remain across its schools. We find that Boston’s schools got significantly more integrated during the period of mandatory school desegregation in the 70s and 80s,but that this progress has stalled since 2000. On some measures, our schools have actually gotten more segregated in recent years, both by race and by income.
Boston’s got a lot going for it, but we’re gradually becoming a city of high-income, childless professionals. We’ve also seen growth in the number of lower-income families, in part driven by those who are fortunate enough to get off of waitlists and secure subsidized housing. But we’re losing other families who can’t afford the city’s rising housing costs, and our middle class is hollowing out. This report dives deep into these trends in three parts by analyzing:
PART 1: BOSTON'S DECLINING SCHOOL-AGED POPULATION
PART 2: THE GROWING MISMATCH BETWEEN CITY AND SCHOOL DEMOGRAPHICS
PART 3: THE INCREASING ISOLATION OF STUDENTS OF COLOR AND LOW-INCOME STUDENTS IN BOSTON SCHOOLS
We hope this demographic analysis will help accelerate public conversations about how we can welcome all families back to the city and promote greater economic and racial integration in our schools.
BOSTON'S DECLINING SCHOOL-AGED POPULATION
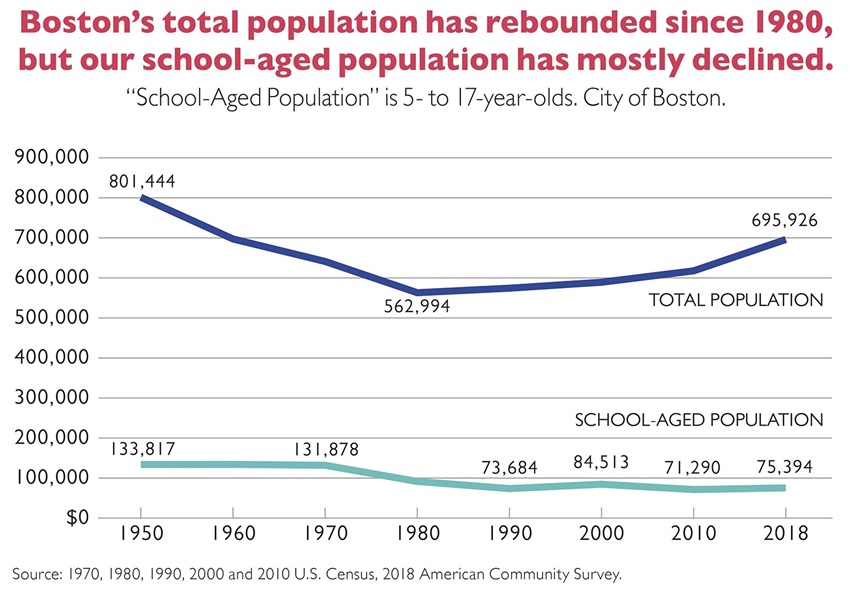
Boston struggled as a city during the post-war decades of the 1950s, ’60s and ’70s, losing 30 percent of its population over a short 30-year period. But Boston has experienced a strong resurgence since 1980, regaining population from that low point almost 40 years ago. Despite this overall population rebound, our school-aged population has actually continued declining (for this report, we define “school-aged” using the standard Census category of 5–17 years of age). Today, our total population is only 13 percent below the city’s 1950 high water mark, but our school-aged population is barely half what it was in 1950.
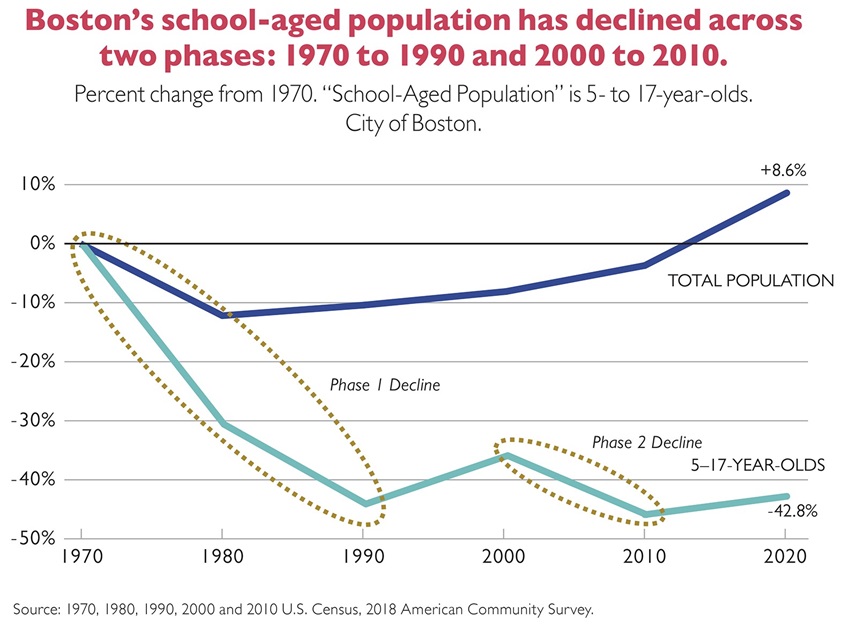
One way to think about this long-term picture is to isolate two separate periods of school-aged population decline, both of which were driven in part by declining fertility rates nationwide (see the next section for more detail). During the first of these periods, from 1970 to 1990, Boston’s school-aged population dropped by more than 58,000, a decline exacerbated by local factors like court-ordered school desegregation and suburbanization of the Boston region. From 1990 to 2000, Boston’s school-aged population rebounded slightly, but the increase was more than offset by another decrease of more than 13,000 between 2000 and 2010.
Strikingly, even as Boston lost school-aged kids over these two time periods starting in1970, we quickly regained population at all other age levels. By the early 2010s, our total population had rebounded to its 1970 level, and it’s grown steadily ever since.
It’s important to note that from 2010 to 2018, Boston’s school-aged population has actually grown somewhat, albeit from a significantly depressed level in 2010. While this recent uptick could signal the beginning of a new trend, Boston has a long way to go in fully recovering from the losses of the two previous periods of decline.
The more recent second phase of decline beginning in 2000 was driven by declines among white and Black children, in particular. In fact, while Boston lost many more white school-aged kids during the 1970 to 1990 phase, Boston has lost more Black kids in recent years. Specifically, Boston lost roughly 8,400 Black school-aged kids and 4,700 white school-aged kids between 2000 and 2017. Our Asian school-aged population remained roughly level since 2000, and our Latino school-aged population increased by roughly 3,700. Boston has also experienced a sharp drop in middle-income families, as they've increasingly been pushed out of the city due, in part, to a dearth of affordable market-rate housing (we describe some of these housing dynamics later in this report).
Parental perceptions of Boston schools are also likely a factor across both phases of decline. After running an intensely segregated school system for many years and dragging its heels on desegregating voluntarily, Boston began a well-documented period of court-ordered school desegregation in the mid-1970s. Because the desegregation plan applied only to schools within Boston, and did not include the-surrounding suburbs, many white families avoided participating in desegregation efforts by moving out to the suburbs during the late ’70s and ’80s.
During the more recent period of decline, numbers indicate that many families,especially higher-income ones, stayed in Boston when their kids were ages zero to four, but then left Boston when their kids turned school-age. Whether or not-such assessments are fair, the perception that K–12 schools are “better” in the region’s higher-income suburbs is one likely reason why higher-income suburbs (like Winchester, Belmont and Wellesley) experienced some of the largest school-aged population gains in our region since 2000. We describe these regional trends further in the Appendix of this report.
As American families have fewer kids, the school-aged population share has declined nationwide. High-income, coastal cities like Boston have seen especially steep declines.
Due to fertility rates, the school-aged population share has declined nationwide, not just in Boston. As of 2018, the general fertility rate in the U.S. had declined to 59 births per 1,000 women of childbearing age—a record low, according to the National Center for Health Statistics.1 By comparison, the general fertility rate was over 70 in 1990 and over 120 in the late 1950s. Major causes of the current low fertility rate appear to include fewer teen pregnancies and the lingering economic effects of the Great Recession on young adults.
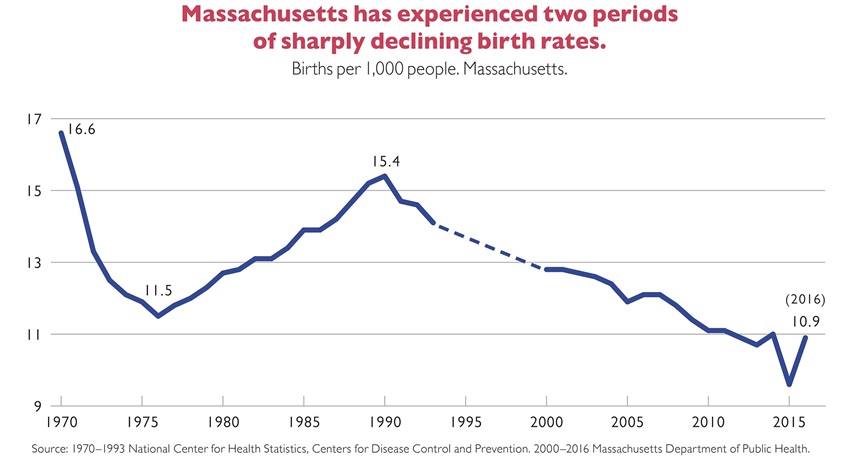
Massachusetts has roughly mirrored these national trends. From the mid-1970s to1990, as Baby Boomers entered prime child rearing years, birth rates actually increased. In 1990, however, birth rates began declining again, and they’ve continued declining for almost 30 years. In 1990, for every 1,000 Massachusetts residents there were approximately 15 births. By 2016, the rate was down to 11 births per 1,000 residents. (Note: The graph below uses birth rates rather than fertility rates, since we do not have fertility rate data at the state level going back to the 1970s. The two measures show very similar trends, but birth rates per 1,000 will always be much lower in absolute terms than fertility rates per 1,000; birth rates include all people in the denominator whereas fertility rates only consider women of childrearing age.)
At the national level, these trends have meant that 5–17-year-olds went from 26 to16 percent of the population between 1970 and 2018. The aggregate total of school-aged kids actually remained pretty level, but this happened in the context of a country that was growing rapidly overall. Boston and similar high-income, coastal U.S. cities have tended to see even sharper declines. As shown in Figure 1 above, Boston’s total population has also grown in recent decades, but rather than having a school-aged population that leveled off as it did at the national level, Boston’s school-aged population has actually declined, even in the aggregate.
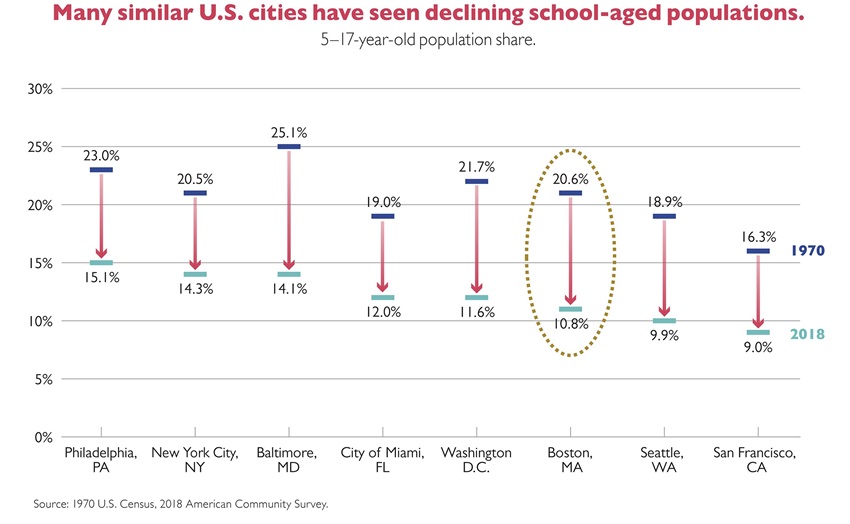
The graph below compares Boston to a subset of similar cities based on size, demographics and density. Each of these cities has a school-aged population share that’s lower than the national average. Boston’s school-aged population dropped somewhat from the fourth-highest among these cities in 1970 to the sixth-highest in 2018. These losses are likely being driven by many different factors—e.g., declining fertility rates and perceptions of school quality in urban areas—but it’s clear that the rapidly rising cost of housing is among the most common push factors for families leaving major U.S. cities. A 2015 Governing Magazine analysis of housing size and affordability found that affordable 3+ bedroom homes in Boston made up just 17 percent of units listed on the market at any given time. In San Francisco, that number falls to just 6 percent.2 Interestingly, there’s even some evidence that rapidly rising housing costs can lead families to have fewer kids, suggesting an interplay between rising housing costs and declining fertility rates. Studies in both the United States and England have found that as rising housing costs make it harder for young couples to make ends meet, fertility rates of women in their 20s and 30s have declined.3
Other analyses have found similar declines among families living in major U.S. cities.For instance, one analysis that looks at the shorter time frame of 2000 to 2017 found that high-density U.S. cities have seen a decline in 25–49-year-old residents who have kids older than six. They’ve seen a modest increase in young families with kids under six (who are mostly not in K–12 school yet) and dramatic increases in those with no children (8 percent increase). The fastest-rising group, according to this analysis, is white, college educated 25–49-year-olds who have no kids—they increased 22 percent between 2000 and 2017.4
These trends also vary across Boston’s neighborhoods and within the Greater Boston region, which we explore briefly in the Appendix. Please go to the end of this report to see neighborhood-level change and how Boston trends compare to the rest of the region.The analysis shows that on the whole our region actually saw a modest gain in school-aged kids since 2000 (+1.5 percent), despite the fact that fertility rates have been declining nationwide, suggesting strongly that the recent decline in school-aged kids in Boston is heavily influenced by local factors like housing and education. Our brief regional analysis also shows some interesting contrasts between regional urban centers like Gloucester and Peabody, with significant declines, and higher-income suburbs like Winchester and Wellesley, with large increases.
The sharpest decline has been among middle-income families with kids.
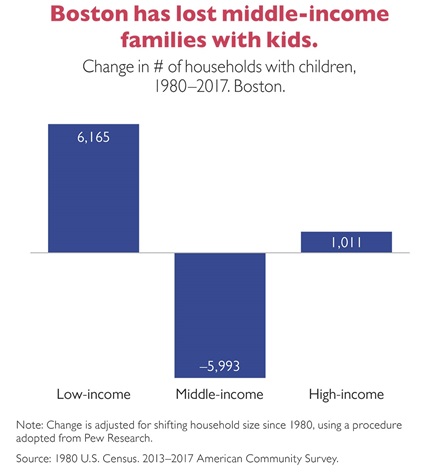
There’s an important income dynamic to these trends. The families that U.S. cities are losing fastest are those in the middle of the income distribution. These are families that tend to be above the income cutoff for subsidized housing programs and yet earn below what it takes to afford the fast-rising housing costs in many of these high-income cities. In today’s Boston, there are almost 6,000 fewer middle-income households with kids compared with 1980, even though our city has grown in total population (see Figure 5).
Please see Methodological Note 1 for detail on how we define low, middle and high income in this report.
Much of what’s driving these changes in household composition by income is the broader macroeconomic trend of increasing income inequality nationwide. Over the past few decades, the gains of economic growth have increasingly gone to those at the very top of the income distribution, and wages at the middle of the income distribution have stagnated as a result.
We’ve seen growth in high-skill, high-pay parts of the economy (e.g., science and technology) paired with growth in low-skill, low-pay parts of the economy (e.g.,service and hospitality). We’ve seen much slower growth for decent-paying jobs at the middle of the income distribution. Wage polarization is fundamentally a national issue,but it’s a heightened problem in cities like Boston where economic growth has been especially uneven. In fact, Boston has the seventh highest income inequality among major U.S. cities, according to a recent Brookings Institution analysis.6
These national trends interact with local factors like rising housing costs to exacerbate challenges for middle-income families. With a well-functioning housing market, where supply for family-friendly housing (i.e., townhomes, triple-deckers, apartments with two or more bedrooms) can rise to meet demand, middle-income households should be able to afford market-rate housing options without receiving public subsidies. But many parts of Boston and our broader region have limited the production of new housing, and costs have skyrocketed as a result. As of September 2019, median rent for three bedroom apartments currently listed on the market in Boston was $2,550 per month.7 Families would have to earn $115,000 per year in order to keep annual rent payments less than 30 percent of their income, a common benchmark for assessing whether a household is ”housing cost burdened.”
Homeownership, too, has gotten increasingly out of reach for many in Boston. Using 2018 data, the real estate firm Unison recently estimated how long it would take a middle-class household to save toward a down payment on a first home in every major city in the country. For Boston, it estimates that for a family earning at the median, and saving 5 percent of their income per year, it would take 30 years to save up for a 20 percent down payment for a median-priced home.8 This means that a family starting from scratch in their mid-20s could not purchase a first home in Boston until they were in their mid-50s.
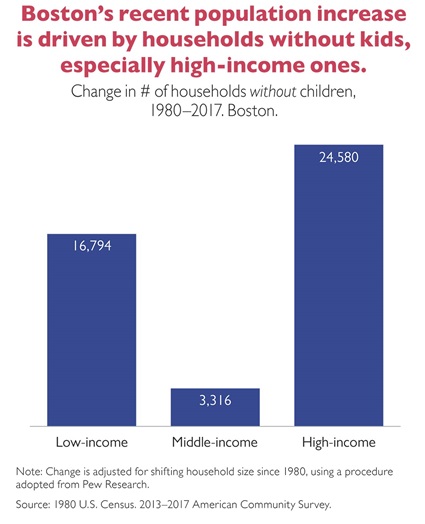
By contrast, when looking at change in households without kids, as we do in Figure 6, we see that Boston experienced increases across all three income categories, but with an especially large increase among high-income households without kids—up almost 25,000 between 1980 and 2017. This mirrors the story across high-density cities nationwide, with many of them increasingly becoming home to childless professionals and empty nesters.
Both Figures 5 and 6 above also show increases in low-income households, regardless of whether they have kids. Many factors have likely contributed to this trend. New immigrants have helped fuel our city’s recent growth, and it’s quite likely that without these new immigrants, Boston’s school-aged population would have declined even further. While many immigrants to Boston are high-skilled, higher-wage workers,others are lower-skill workers who likely show up in this analysis as “low-income.”9
Another significant factor is the growing commitment that the City of Boston has made to providing income-restricted housing options to help lower-income residents afford to remain in the city. As private developers have built new multi-unit residential projects, the City has required them to contribute to the construction of new units available for lower-income households at below-market rents. Today, almost one in five housing units citywide (19 percent) is income-restricted in one way or another. Some of these units are in longstanding public housing developments, some have been created by private affordable housing developers, and some are affordable set-aside units created through the city’s Inclusionary Development Policy. This 19 percent estimate is actually a low-end estimate because it does not count several thousand additional federal and state tenant-based vouchers, which help low-income households pay rent in market-rate apartments. There is still tremendous unmet need for income-restricted housing, and there’s no question that we need to continue to do more, but the City’s Department of Neighborhood Development argues that this is the largest share of income-restricted units of any major U.S. city.10 The growth in these income restricted units is one reason that a meaningful number of low-income residents have been able to remain living in a city like Boston where our market rate housing stock has otherwise become increasingly unaffordable.
Many families, especially higher-income ones, leave Boston when their kids turn school-age.
Boston’s decline in families with kids is even more conspicuous when focusing on those with school-aged children between the ages of five and 17. Many families actually remain in Boston when they have babies and preschoolers, but there’s a significant drop-off when these kids turn five (roughly the age for beginning kindergarten). Boston has about 35,000 residents aged zero to four but only 28,500 aged five to nine (both of these age groupings capture five distinct years of life). In other words, we have about 18 percent fewer kids who are old enough to attend early grades in public school (five to nine years old) than we do kids who are infants, toddlers and preschool-aged (zero to four years old).
It’s important to emphasize that the data we present in this section are rough estimates with very large margins of error because they are based on American Community Survey data from small numbers of respondents within each of the identified age/race/income subgroups. The broad magnitude and direction of trends presented in these graphs are indicative of real dynamics on the ground in Boston, but precise numbers should not be drawn from these graphs
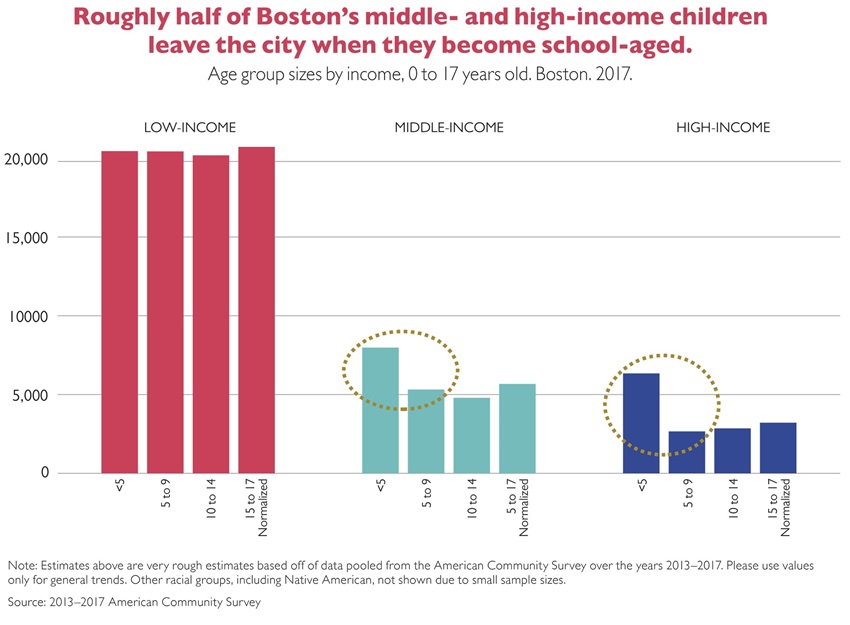
These declines are especially pronounced for middle- and high-income kids, as shown in Figure 7. Among high-income households, for instance, Boston is home to more than twice as many zero- to four-year-olds as five- to nine-year-olds (roughly 6,300 compared to 2,700). We see a similar, although slightly less dramatic, drop among middle-income families when their kids turn school age. By contrast, there’s no drop-off at all for low-income kids living in Boston.
Analysis across these age groups can be difficult because we don’t have data that allow us to track the movement of individual kids and families over time. Fortunately, we can use Census data to break down child demographics by specific age bands, races and incomes, as we do in Figures 7 and 8. Though we’re analyzing a snapshot in time, we compare the number of kids across different age buckets and interpret that change as reflective of people moving in and out of the city. This approach is not perfect for assessing movement of actual families, but it is strongly suggestive of broad trends.
For more detail on how we’ve constructed this analysis, including how we’ve adjusted the15–17-year-old bucket to facilitate apples-to-apples comparisons with earlier five-year age bands, please see Methodological Note 2.
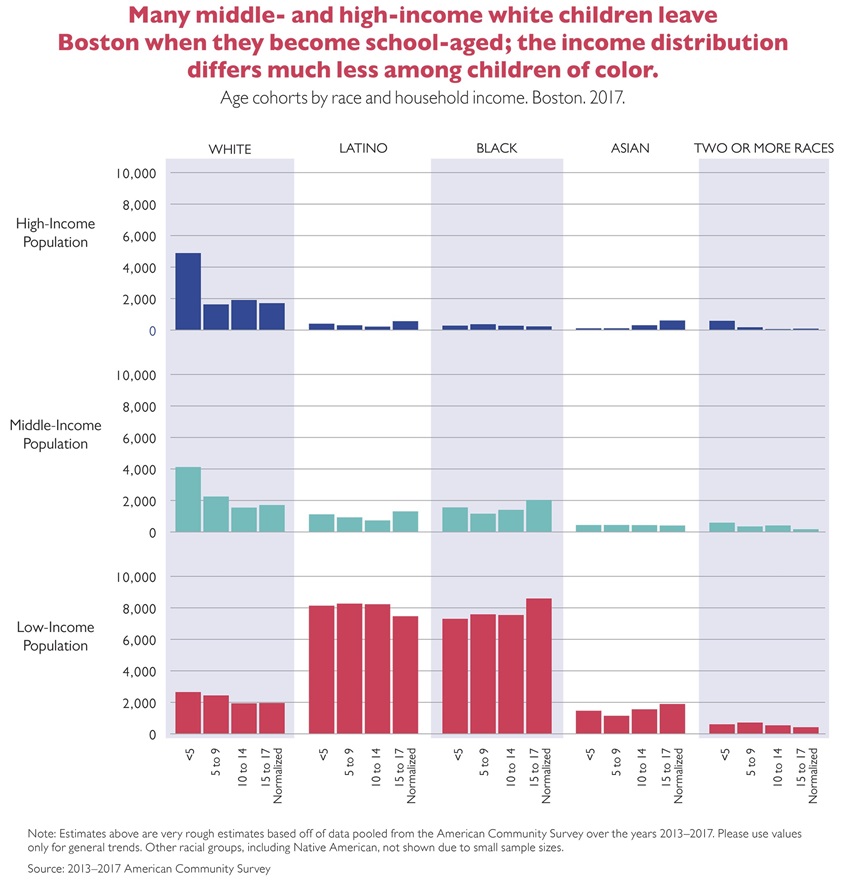
Next, we further disaggregate these income clusters by race (Figure 8 below). Looking at all income levels, Boston actually has similar numbers of young kids aged zero to four who are white (~11,500), Latino (~10,000) and Black (~9,000). But the vast majority of families who leave the city when their kids shift to the first school-aged grouping (five to nine years old) are white. High-income white households with kids are the ones most likely to leave the city when their kids become school-aged; Boston has about three times as many high-income white kids aged zero to four (~4,900) as it does high-income white kids ages five to nine (~1,600). Many middle-income white households also leave between these two age groupings—Boston has 45 percent fewer five- to nine-year-olds than zero- to four-year-olds.
Such a marked drop among families living in Boston with school-age children suggests that perceptions of school quality may play a role in families’ decisions to leave. But it is not immediately clear what drives their perceptions. While there’s a broad-based consensus that Boston schools need to provide stronger educational opportunities, particularly for low-income students and students of color, there’s little evidence that the schools have gotten notably worse over the last 15 years. If anything, student outcomes have improved a touch—e.g., MCAS performance increased over the early 2000s, though declined a bit in recent years; graduation rates are up significantly—even as Boston’s schools are serving a larger proportion of low-income students who tend to have greater educational needs. Further, a recent analysis of Boston Public School outcomes, An Uneven Path: Student Achievement in Boston Public Schools, 2007–2017, found that BPS performance on the National Assessment of Educational Progress continues to be a bit higher than that of other large urban districts, although these other districts have seen gains in recent years while BPS has plateaued or even declined slightly.11
Parents may be responding to what they believe is at stake for their children in receiving a high quality K–12 education. Since 1980, for example, inflation-adjusted wages for people with college or other advanced degrees increased by 30 and 44 percent, respectively, while wages for people with only a high school diploma were essentially flat.12 With an eye toward higher education, parents today may be more critical in assessing the quality of local schools than they were in previous generations, despite some real improvements to student outcomes. Their worry on this front is possibly leading more of them to consider settling outside in suburbs of the city with better resourced public school systems. And as we show in Figure 9, white kids in Boston tend to be in families with significantly higher incomes, giving their parents more options to consider moving out of the city in order to attend different schools.
Finally, it’s important to note that perceptions of school quality have been closely tied to implicit (or in some cases possibly explicit) racial biases. There’s evidence that many white parents actually use racial demographics subconsciously as a proxy for school quality.13 One large study, for instance, found that when white parents consider school placement for their children, many will eliminate from consideration schools with significant shares of Black students, even if those schools otherwise have high test scores and modern school facilities.14 Along with factors like rising housing costs and declining fertility rates, such biases may also be contributing to what’s happened in recent years; as Boston’s schools get increasingly non-white, it may be fostering a sense among white families that Boston’s schools are getting worse, even though actual student outcomes in the classroom have not declined.
The combined income and race analysis above shows that white kids in Boston are much less likely to live in low-income households than either Black or Latino children. Small shares of Black, Latino and Asian kids live in middle-income households, and almost none live in high-income households in the city. Among Asians, we do see modest increases in high-income households living in Boston with 10–17-year-olds.
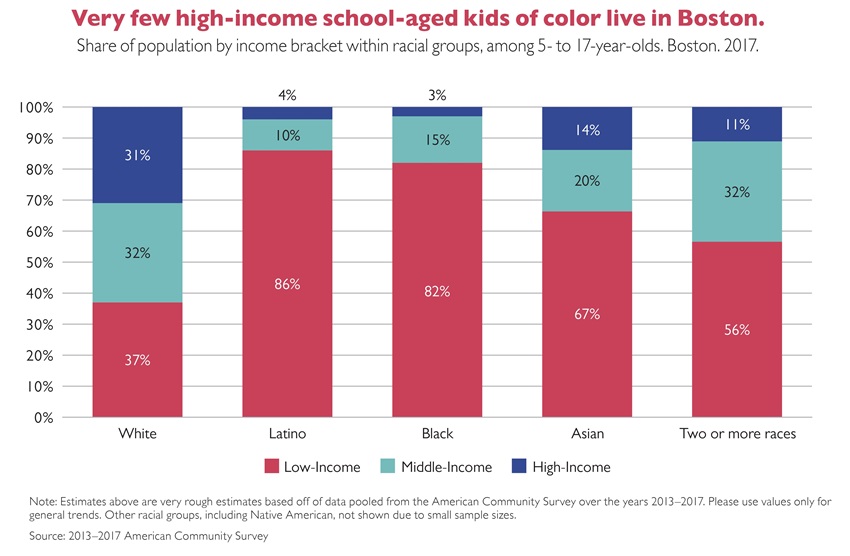
Part of what may be happening here is higher-income Asian families with older kids choosing to live in Boston so that their kids can attend Boston’s exam schools—Asian students’ share of Boston’s exam schools student body is three times as large their share in Boston’s public schools overall: 24 percent versus 7 percent. There’s a similar dynamic among high-income white households with kids ages 10–17. There are 17 percent more high-income white kids aged 10–14 than there are 5–9. Moreover, white students make up only 13 percent of public school enrollment in Boston, yet represent 32 percent of exam schools. Combining these 5- to 17-year-old groupings, as we do in Figure 9, allows us to get a sense of the income distribution across all school-aged youth by race. The population of white 5–17-year-olds has a remarkably balanced income distribution; each bucket composes roughly a third of the population. Most notably though, Boston’s Latino and Black school-aged populations are largely made up of low-income youth—more than eight in 10 school-aged Black and Latino kids in Boston live in low-income households and very few live in high-income ones. School-aged Asian kids in Boston tend to come from families with a bit higher incomes, but still two-thirds of them live in low-income households.
More often than not, it is these lower-income youth of color that Boston’s public schools are educating—a topic that we explore more fully in Parts 2 and 3 of this report.
THE GROWING MISMATCH BETWEEN CITY AND SCHOOL DEMOGRAPHICS
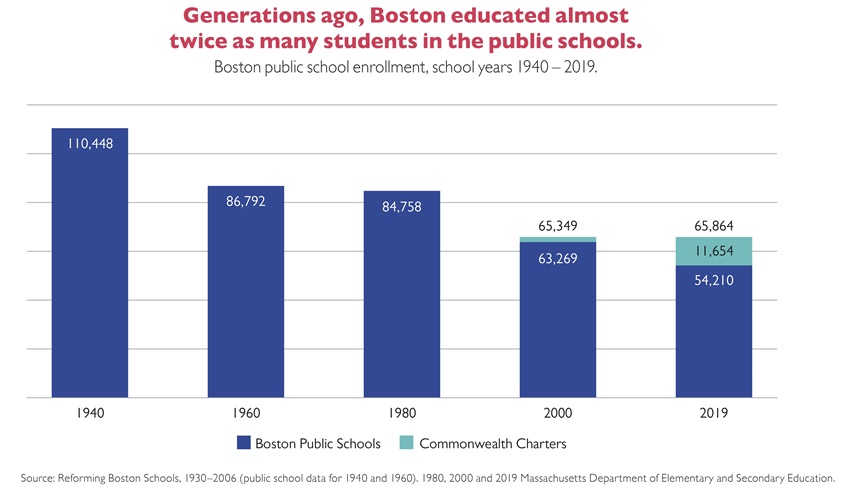
So far we’ve focused on trends among school-aged kids residing in Boston; next we transition to an analysis of how these changes have played out in terms of who’s attending Boston’s schools. Boston was once home to many more families, with almost twice as many kids being educated in our public schools. Back in 1940 Boston’s population was nearly 800,000 compared to just under 700,000 in 2018. In 1940, Boston’s public schools educated as many as 110,000 students; today, it’s down to 66,000. The recent pace of Boston’s population growth and economic development can sometimes feel jarring, but we have in the past actually accommodated many more residents, including many more families with kids.
Note: For many of this report’s analyses of public school enrollment, we include students in Boston’s Commonwealth charter schools. We make a subtle labeling change to mark this distinction: When we use all caps for “Boston Public Schools” we are referring to district-run schools (including Horace Mann charters) and not counting Commonwealth charters; when we use “Boston’s public schools,” we are referring to all publicly-funded schools attended by Boston residents and do include Commonwealth charter schools.
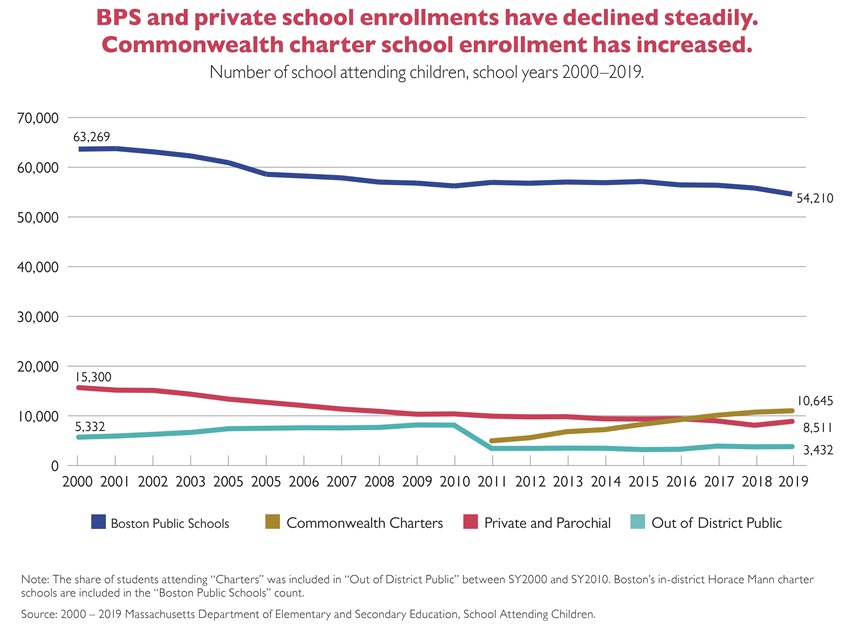
Focusing on the more recent period of school-aged population decline, from school year (SY) 2000 to today, we see that the biggest enrollment declines have been in non-charter district, private and parochial schools. A significant part of what Figure 10 shows is how parents are increasingly turning to Commonwealth charter schools to educate their kids.
Tracking charter enrollment trends in the graph below is somewhat confusing because up until SY 2010, the Department of Elementary and Secondary Education (DESE) included Boston residents attending Commonwealth charter schools in its “Out of District Public” school category. A key reason for the increase in“Out of District Public” enrollment from SY 2000 to SY 2010 (Figure 11) is the gradual increase in Commonwealth charter school seats in the Boston area. In SY 2011 DESE began to count charter-attending students in a new standalone category (gold line in the figure below). Charter enrollment continued to increase in more recent years after the state upped the charter school enrollment cap in 2010. Boston is now close to that higher cap, so further growth in charter enrollment is less likely.
In fact, when we combine all public school types in Boston (Boston Public Schools + Commonwealth charter schools + out-of-district public schools) we see that enrollment has actually stabilized since 2000. There’s an important silver lining here: While BPS has lost students to charters, all public school types combined have actually seen enrollment increases. Their combined market share of all school-aged kids living in the city has even increased a bit over this time frame because, as we showed earlier, Boston lost school-aged population between 2000 and 2018.
Offsetting these increases to combined public school enrollment has been a consistent decline in students attending private and parochial schools, a trend that actually began well before 2000. Ideally we’d have better data for recent years allowing us to tease out trends among Catholic schools, independent private schools and other religious schools, but the DESE data only have these combined together (as shown in Figure 11). In the late 1970s, Catholic schools saw a boost in attendance when enrolling in private schools was one strategy many white families used for avoiding participation in Boston’s school desegregation efforts. The Archdiocese publicly supported the desegregation of Boston’s public schools and in 1974 officially closed its doors to the enrollment of families attempting to transfer out of the public schools. But enforcement of this order was difficult and patchy, and ultimately, a number of Catholic schools in and around Boston accepted student transfers from the city despite this prohibition, with close to 2,500 white students leaving the city’s system in the first two years of desegregation. After this temporary spike, Catholic school enrollment has declined gradually from the late-70s to today: In 1976, roughly 25,000 students attended Catholic schools located in Boston, compared to around 7,000 in 2018.15
As fewer kids attend Boston’s public schools, those who do are more likely to be low-income and Latino.
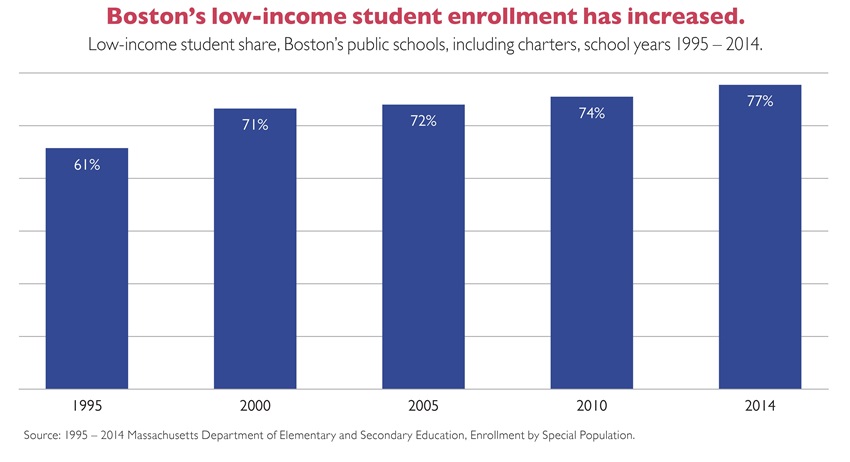
As we showed in Part 1, families leaving Boston when their kids turn school-aged tend to be middle and high income. As a result, Boston’s public schools are now educating a larger proportion of students from low-income families who tend to have greater educational needs. Beginning in SY 1995 (the earliest year for which we have reliable data on income at the district level), we’ve seen a 16 percentage point increase in the share of low-income students attending Boston’s public schools—this share increased from 61 percent in 1995 to 77 percent in 2014 (see Figure 12). The increase is equally dramatic when looking at the total number, rather than percentage, of low-income kids. Boston’s public schools served 10,000 more low-income students in 2014 than they did in 1995.
For more detail on data sources for measuring low-income students and an explanation for why we only have good trend data up until 2014, please see Methodological Note 3
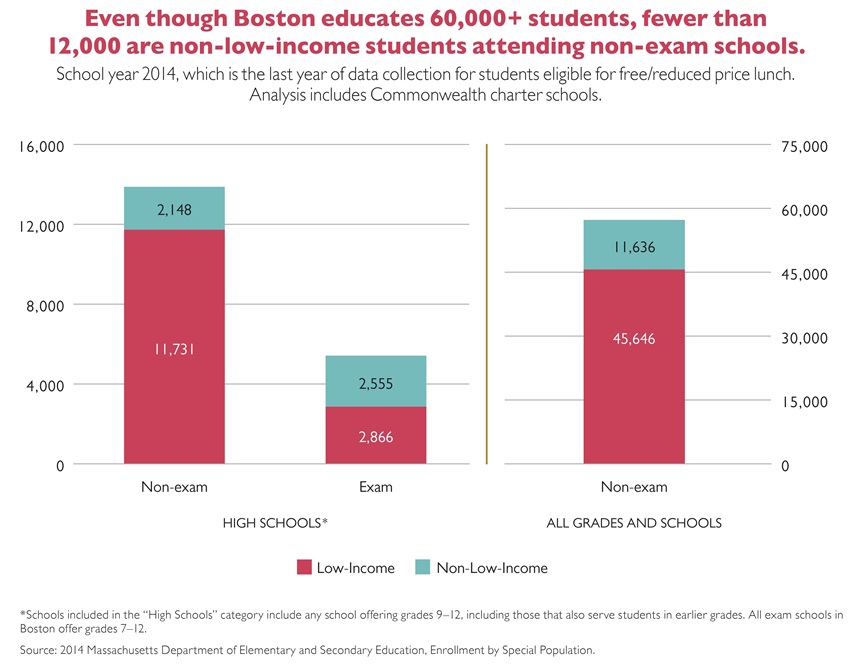
Further, Boston’s growing concentration of low-income students looks even starker when separating out Boston’s exam schools, which have a competitive exam-based selections process. We dive deeper into the issue of school segregation in Part 3 of this report, but because Boston’s exam schools tend to serve higher-income students, in Figure 13 below we compare enrollment patterns for students of different family incomes by treating exam and non-exam schools separately.
After subtracting exam school enrollment, the low-income student enrollment share increases from 77 to 80 percent across all schools. The concentration of low-income students is most extreme in Boston non-exam high schools. Roughly 12,000 students attending these schools come from low-income families, making up 85 percent of all non-exam high school students. Conversely, only about half of students attending exam schools are low-income (2,800 students or 53 percent of all exam school students). Another striking data point that emerges from this analysis is that in a district with more than 60,000 students, there were fewer than 12,000 middle- and upper income students attending any of Boston’s non-exam schools in 2014.
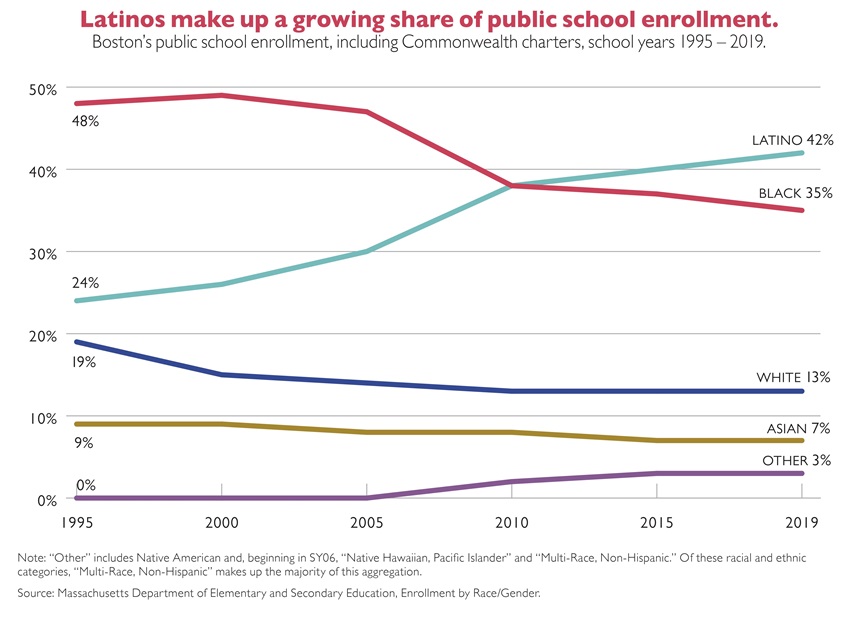
As Boston’s low-income student share increased, so too did its share of Latino students. Back in 1980, BPS was roughly two-thirds students of color (65 percent), in 1995 it was 81 percent students of color, and today Boston’s public schools (including charters) are 87 percent students of color. Since 1995, this growth has been driven almost entirely by Boston’s Latino student population, increasing steadily over this time frame from 24 to 42 percent of school enrollment (Figure 14).
By far the largest decline has been among Black students, dropping from almost half of public school enrollment in 1995 (48 percent) to about a third (35 percent). This decline of more than 6,000 Black students attending public schools in Boston is twice as large when looking just at Black students enrolled in non-charter district schools (a decline of 12,230 students). This is because in recent years Boston’s charter schools have been especially popular among Black families in Boston. In fact, Black students make up more than half (51 percent) of all charter enrollment in Boston, compared with just under one third of overall BPS enrollment. Likewise, more than 2,000 of Boston’s Black students show up outside of these analyses because they attend public schools in affluent suburbs like Newton and Lexington through the Metropolitan Council for Educational Opportunity (METCO) program. Black students make up 68 percent of METCO student enrollment statewide.16
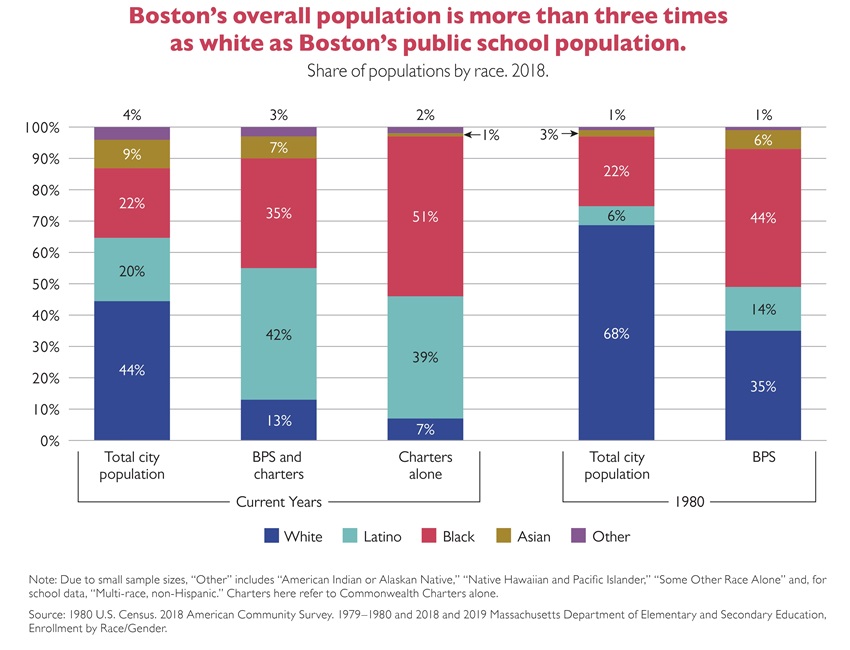
These combined trends—the declining number of middle-income families living in Boston and the increasing proportion of low-income students and Latino students attending the city’s schools—reflect a growing mismatch between city and school demographics (see Figure 15 below); the kids living in Boston and attending Boston’s public schools are quite different from the rest of the city.
For a long time, Boston’s total resident population has been more predominantly white than the city’s public school population. In 1980, for instance, BPS’s white student enrollment share was roughly half of the city’s white population share (35 percent compared to 68 percent). But this mismatch has become even more extreme today—the white enrollment share in Boston’s public schools (including charters) is now less than a third of the city’s white population share (13 percent compared to 44 percent).
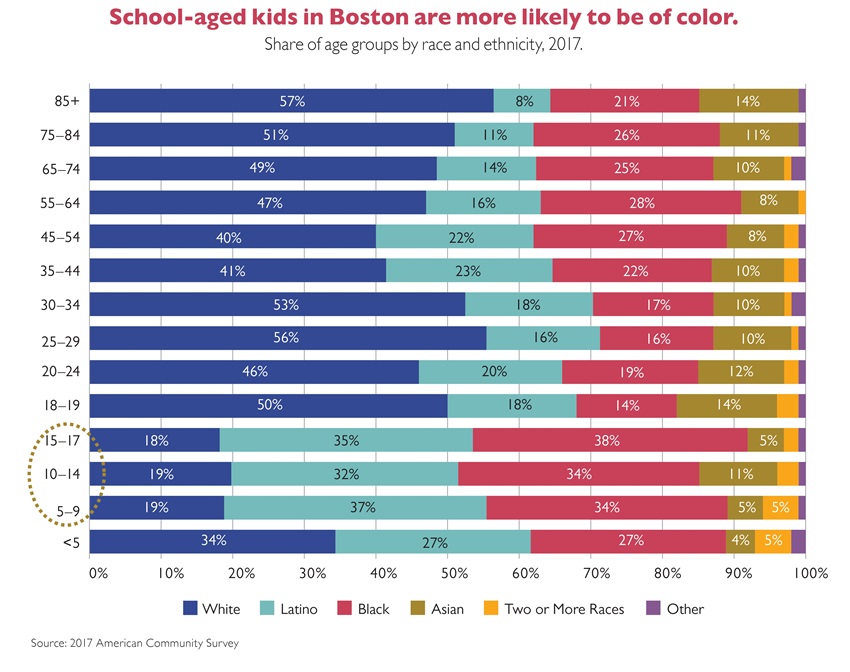
A similarly disparate picture also emerges when comparing the racial breakdown of different age groupings living within Boston. The analysis in Figure 16 below just looks at residents of the city, rather than kids enrolled in Boston schools, and it shows that the city’s school-aged population is less than 20 percent white whereas more than half of residents ages 65+ are white. It’s worth noting that using shares rather than aggregate totals, as we do in the graph below, makes it look like Boston loses Black and Latino young adults (roughly ages 18 to 34) since their shares drop from the mid 30 percent range (for 5-to 17-year-olds) to the high teens (for 18- to 34-year-olds). What’s causing this drop is the huge influx of white and Asian young adults who move to the city for college and jobs. The aggregate totals for Black and Latino young adults are not decreasing.
So far this analysis has focused mostly on changing residential composition and Boston school enrollment in the aggregate. Next, in Part 3 of this report, we look more closely at the experience of students attending individual schools in Boston, analyzing how well integrated (or not) our public schools are today.
THE INCREASING ISOLATION OF STUDENTS OF COLOR AND LOW-INCOME STUDENTS IN BOSTON SCHOOLS
Boston is a far more diverse city these days than it was even a few decades ago. But this diversity masks a growing mismatch, as Boston’s children are significantly more likely to be children of color and to come from low-income families than city residents overall. Boston children are also more likely to attend schools that have become far less integrated in recent decades, both racially and socioeconomically.This is troubling in light of the wide range of important benefits associated with educating children in integrated schools. A large and growing body of evidence consistently finds that students who attend diverse schools have better academic,social, behavioral and economic outcomes—all advantages that collectively position them to succeed in an increasingly diverse workplace and break the cycle of intergenerational poverty (see Benefits of Integrated Schools, below).
Benefits of Integrated Schools
Attending schools integrated by race or by students’ socioeconomic background has been consistently associated with higher academic achievement in a number of subjects.17 The academic advantages to racially diverse schools accumulate over time; they hold for all grades but are higher in middle and high school grades. Notably, students of all racial backgrounds, including white students, benefit academically from attending a racially integrated school.18 Attending these schools has also been associated with lowering achievement gaps by race, particularly by elevating Black and Latino student achievement.19 Interestingly, in schools integrated by socioeconomic status (schools made up of a mix of low-, middle- and higher-income students), lower-income students appear to be the principal beneficiaries of integration. For example, these students see their test scores grow by 30 percent over peers in schools with concentrated poverty.20
The benefits to schools integrated by race or socioeconomic status extend beyond improved academic achievement in K–12 grades: Students who attend integrated schools are more likely to graduate from high school, to enroll in college and to complete a post secondary degree.21,22 Research on long-term outcomes has also shown that students—and particularly Black students—who attend racially integrated schools are more successful in the work place and beyond in ways that collectively help combat the cycle of inter generational poverty: They have higher wages and higher annual family incomes,greater occupational attainment, lower incidence of poverty and lower likelihood of ever being incarcerated.23
Finally, attending integrated schools is associated with positive cognitive, attitudinal, behavioral and psychological outcomes that position all students to be more successful in the multicultural workplace of the 21st century.24,25 Purposeful attention to how integration affects students’ daily experiences is particularly important to unleashing its benefits,especially for integration by socioeconomic status.26 Students’ experiences in classrooms where they learn alongside peers from different backgrounds and with different perspectives tend to promote critical thinking and problem-solving skills as well as creativity and motivation.27 These experiences are also related to reduced racial and ethnic prejudice, lower likelihood of stereotyping others, increase in inter-racial friendships and trust, and greater cultural competency—all markers of an improved ability to navigate multicultural settings and to succeed in an increasingly diverse workplace and society.28
Diversity, integration and representativeness are complex constructs that can be measured in different ways. To construct a comprehensive picture of how integrated Boston’s schools are, this section attempts to answer two different, but very much related, questions:
How concentrated are Boston’s schools in terms of students’ race and family income?
These analyses describe how racially and economically integrated Boston’s public schools are (or are not) by focusing directly on the racial and socioeconomic concentration of a given school—particularly on the share of each school’s students who are: 1) students of color, or 2) students from low-income families. We lead with these analyses of student concentration because they most directly analyze the experience of students in a given school; they do not compare the demographic or socioeconomic makeup of schools to that of the broader school system.
How representative are individual schools of Boston’s public schools overall?
The representative analyses examine the degree to which Boston’s individual schools are representative of all public school students in the city. Specifically,we examine whether an individual school’s share of students of color (or low-income students) is within 10 percentage points, in either direction, of the respective share in the comparison population (for a total of 20 percentage point band). If a given school’s share is within this band, we consider that school “representative” of Boston’s public schools.
These two types of analyses build our understanding of how a variety of factors may drive these outcomes. The representative analyses allow us to focus on how demographically evenly students are distributed across schools—by local policy choices, such as the school assignment plan, but also, indirectly, by residential segregation in Boston, as the assignment plan takes into consideration school proximity to students’ home neighborhoods. The student concentration measures,by comparison, are driven by a wider range of factors, which include local school assignment policies and neighborhood residential patterns, but also broader demographic trends such as the growing immigrant share of Boston’s population and within-region migration patterns (e.g., leaving city for suburb) of families with school age children.
It is important to note that students of color in Boston represent different races and ethnicities—and their composition has changed over time. In 1980, for example, Black students made up more than two thirds of the district’s students of color, and at 44 percent, their share was more than three times as high as that of Latino students (14 percent). But by 2019, the share of Latino students had surpassed that of Black students, accounting for 42 percent of all public school students and nearly half of all students of color. To reflect this complexity, in this section we sometimes analyze school integration patterns for separate racial groups; at other times, especially when examining high-level trends over a longer time frame, we group together all students of color.
The figures and tables in this section analyze student enrollment by race and ethnicity for several intentionally selected years spanning the past five decades. The earliest school year is 1966-67—several years prior to the 1974 court ruling that required the district to desegregate schools through a court-ordered busing plan.i The second year is 1979-80, five years after the busing plan took effect. The third year—school year 1999-2000—provides a useful mid-point comparison and is also the year in which the Boston School Committee voted to eliminate the racial makeup of schools as a consideration in Boston’s then-assignment process. Finally, school year 2018-19—the most recent year for which data are available—is five years into Boston’s current Home Based Assignment Plan, which replaced the previous Controlled Choice assignment system in 2015.
In the remainder of this section, we first discuss the results of our analysis of racial and socioeconomic concentration in Boston’s schools, both today and over the past several decades. We then examine the extent to which individual schools in Boston are representative of all public schools in the city, in terms of both race and students’ family income.
As in the first two sections of this report, these analyses group together all public schools in the city: district schools from the Boston Public Schools and Commonwealth charter schools. Commonwealth charter students are slightly more likely to be students of color: In 2019, 93 percent of charter school students were students of color, compared with 87 percent of BPS students.
How concentrated are Boston’s schools in terms of students’ race and family income?
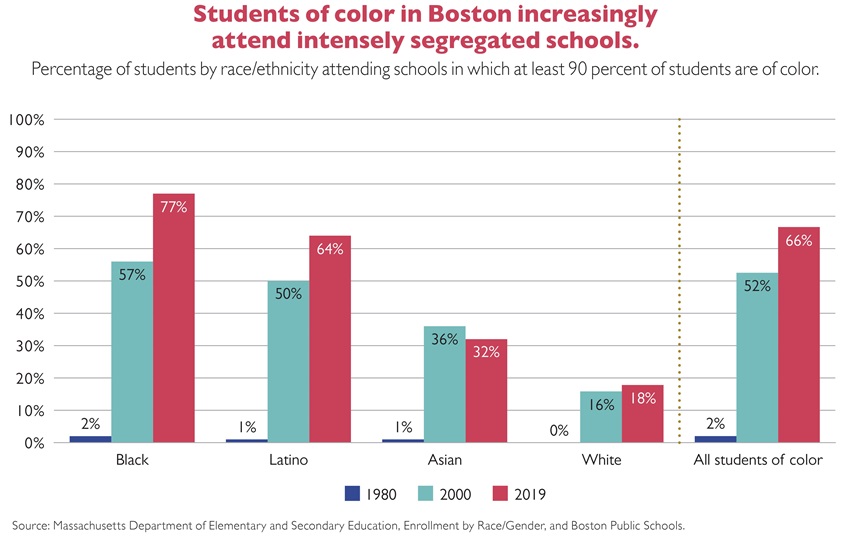
In light of the well-documented benefits of school integration, it is sobering that Boston’s public schools are becoming dramatically less racially and socioeconomically integrated. As Figure 17 shows, more than three quarters (77 percent) of Black students and nearly two thirds (64 percent) of Latino students attend schools in which 90 percent or more of all enrolled students are students of color. Such schools are often considered “intensely segregated”—a definition popularized by the Civil Rights Project at UCLA and now used widely in today’s discussions of school segregation in the press.
Overall, fully two thirds (66 percent) of all students of color in 2019 attended intensely segregated schools—a share dramatically higher than even a few decades ago: In 1980,for example, several years after Boston’s court-ordered desegregation plan took effect,only two percent of non-white students in Boston attended intensely segregated schools.
This trend does not seem to be driven by students of color simply concentrating in a handful of large, racially imbalanced schools. As the analysis in Figure 18 shows, the number of Boston schools enrolling at least 90 percent students of color has been steadily on the rise in recent decades.
In 1967, several years prior to Boston’s court-ordered desegregation plan, there was a pronounced bifurcation of Boston schools into two groups—schools with very few students of color and schools with very large concentrations of students of color.
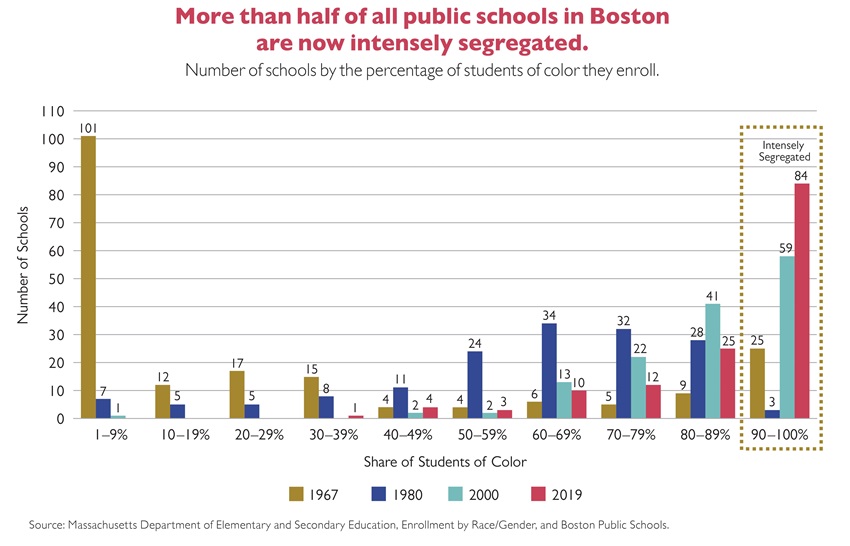
Subsequently, between 1967 and 1980, the number of schools with fewer than 10 percent students of color declined from 101 to 7, and the number of schools with 90 percent or more students of color declined from 25 to 3.
In the decades since then, as many white families with children left (and continue to leave) the city when their children reach school age, it is perhaps not surprising that, by 2019, the number of schools enrolling at least 90 percent students of color skyrocketed to 84. In other words, 60 percent of public schools in Boston today are intensely segregated.
BLACK AND LATINO STUDENTS FREQUENTLY ATTEND SCHOOLS THAT ENROLL NOT JUST MAJORITY STUDENTS OF COLOR BUT MAJORITY STUDENTS OF THEIR OWN RACE.
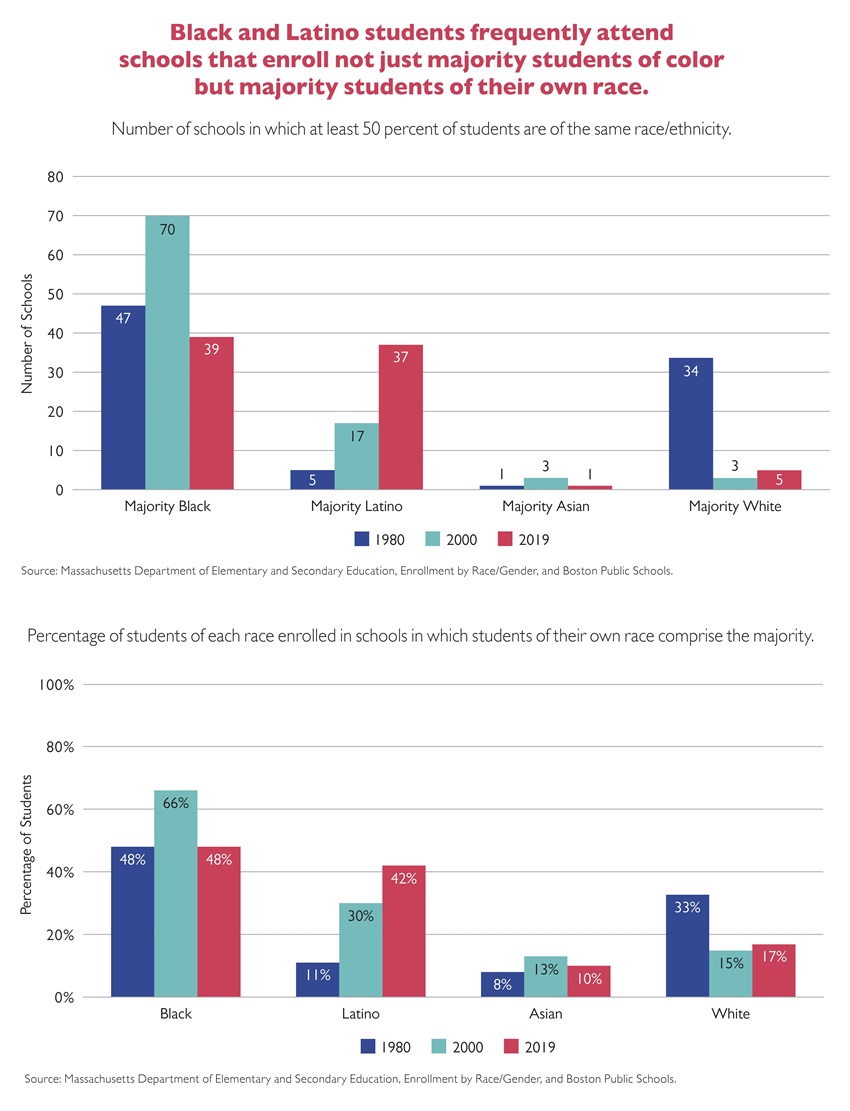
A more detailed analysis of enrollment by specific race/ethnicity groups during school year 2018-19 reveals that 134 of the 139 public schools in the city enroll a majority of students of color. In fact, in 59 percent of schools (82 schools), more than half of all students are from a single race/ethnicity. The isolation of Black and Latino students is particularly pronounced: They frequently attend schools that are not just majority students of color but majority students of their own race. Figures 19a and 19b illustrate these findings in complementary ways. Figure 19a shows the number of schools in which students of a given race/ethnicity form at least 50 percent of total enrollment. But schools vary considerably in size, so how many students in the district would experience that imbalance? In Figure 19b we explore that, by showing the percentage of students of each race/ethnicity who are enrolled in schools in which their own race/ethnicity makes up the majority of students.
As Figure 19a shows, in 2019, Latino students comprised the majority in 37 schools—a number steadily on the rise over the past few decades. In fact, they made up 70 percent or more of students in 14 schools and nearly all students (96 percent) in one school.ii Overall, 42 percent of Latino students attend schools in which students of their own race form the majority—up from 11 percent in 1980 (see Figure 19b).
During the same period, Black students comprised the majority of student enrollment in 47 schools in 1980; that number increased to 70 schools in 2000 before declining back down to 39 schools in 2019 (see Figure 19a). Today, nearly half of all Black students in BPS attend such schools—down from two-thirds in 2000. Furthermore, in 2019,Black students accounted for two thirds or more of all students in 10 schools.
Finally, white students comprised the majority of enrolled students in five schools,with 17 percent of white students attending those schools. Asian students formed the majority in one school—the Josiah Quincy School; that school enrolled 10 percent of all Asian students in Boston’s public schools.
Boston’s continuing residential segregation appears to be a key factor in the student enrollment patterns shown above; the more segregated people’s homes are from the homes of residents who are different from them, the further a district needs to spread some students out in order to balance the schools’ population. School districts can influence the integration of schools independent of housing patterns,but doing so is difficult in areas with high residential segregation—especially if school assignment systems prioritize assigning students to schools closer to their homes, as Boston’s does. It is then perhaps not surprising that seven of the 10 schools with the highest concentration of Latino students are located in East Boston, a neighborhood in which nearly six in 10 residents are Latino. (The remaining three are schools with dual-language programs in English and Spanish.iii) And all 10 schools with the highest enrollment of Black students are located in Mattapan, Roxbury or Dorchester. Three quarters of Mattapan residents and just over half of Roxbury residents are Black; in Dorchester, black residents form a plurality of 44 percent.29
LOW-INCOME STUDENTS ARE INCREASINGLY CONCENTRATED IN A GREATER NUMBER OF SCHOOLS.
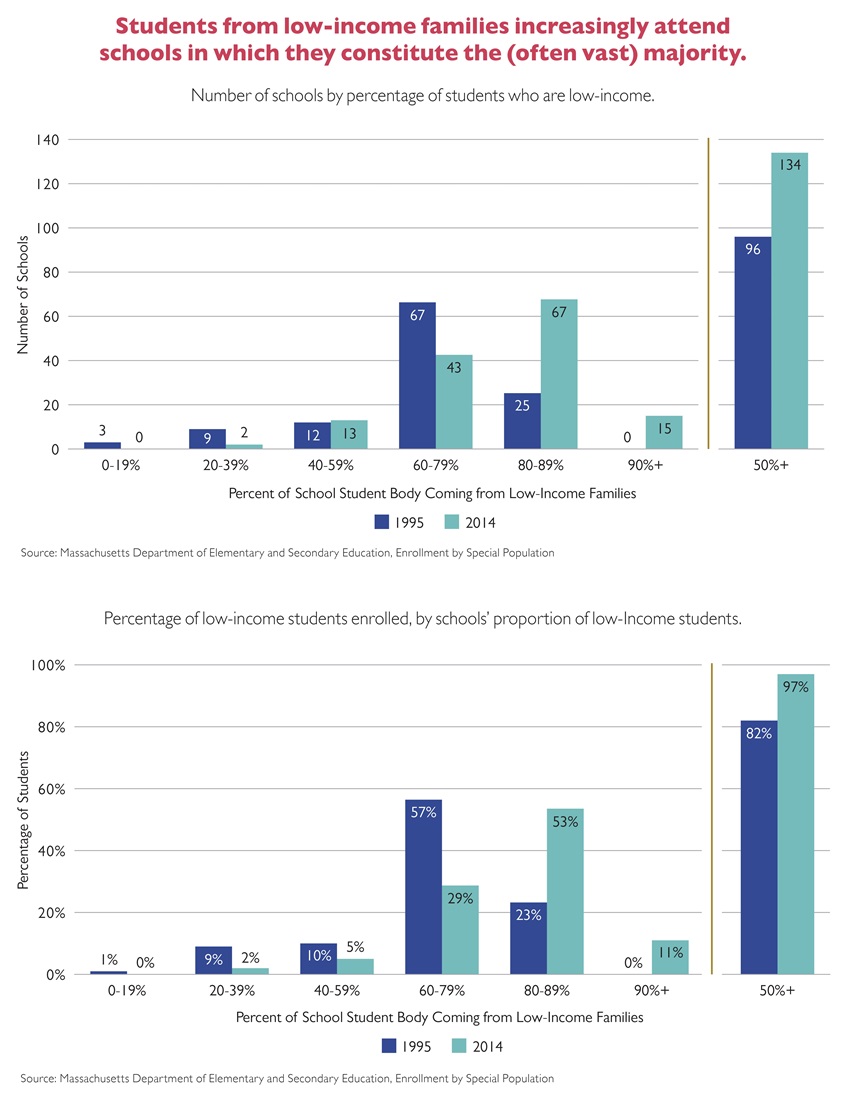
As Section 2 in this report discussed, students in Boston’s public schools are disproportionately more likely to come from low-income families than city residents more broadly: In 2014, more than three quarters (77 percent) of Boston students qualified as low-income. In 1995, their respective share was 61 percent. And unfortunately, over the past 25 years, these students have become even more concentrated in a greater number of schools.We examine this concentration in more depth in Figures 20a and 20b: Figure 20a shows the number of public schools in Boston enrolling different percentages of low-income students; Figure 20b, in turn, shows the percentage of low-income students enrolled in these schools.
Both figures point to the same striking finding: Students from low-income families increasingly attend schools in which they constitute (often the vast) majority. In 2014—the last year for which data on this low-income indicator is available—low-income students accounted for at least 80 percent of enrollment in 82 public schools in Boston (see Figure 20a). This means that nearly two thirds (64 percent) of low-income students attended schools in which more than eight in ten students were also low income (see Figure 20b). And in 15 of these schools, low-income student accounted for 90 percent or more of all students. Furthermore, nearly all schools (134 out of 140) had populations in which the majority of students came from low-income families, and nearly all low-income students (97 percent) attended such schools.By comparison, in 1995, when 61 percent of Boston students came from low-income families, just over one in five schools—25 schools total—enrolled 80 percent or more such students. That year, about a quarter (23 percent) of low-income students attended these schools. Boston had no schools with 90 percent or more of enrolled students being low-income. In 1995, 96 schools enrolled a majority of low-income students; eight in ten (82 percent) low-income students attended these schools (see Figures 20a and 20b).
How representative are individual schools of Boston’s public schools overall?
As Table 1 shows, from 1967 to 2000, an ever-growing number of individual schools in Boston became representative of students in the public school sector (that is, a school’s share of students of color was within 10 percentage points of the system’s share of students of color). This trend has leveled off over the past 20 years; currently, 53 percent of Boston’s schools are representative of overall student enrollment in the city’s public schools—essentially unchanged since 2000.
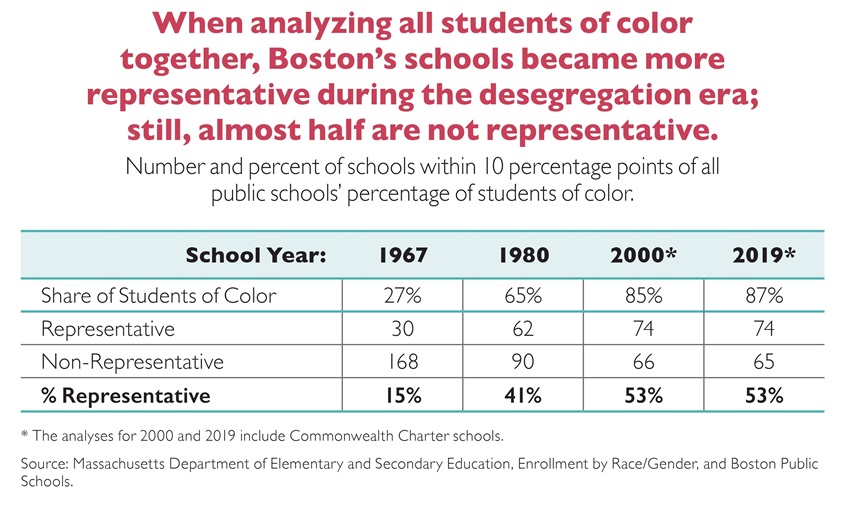
In 1967, while 27 percent of students across the district were students of color, only about 15 percent of schools (30 schools) had student populations within 10 percentage points of this share (i.e., between 17 percent and 37 percent). In large part, this had to do with the fact that in more than half of all schools in 1967, white students accounted for 90 percent or more of enrolled students (see Figure 19). The court-ordered busing plan, first implemented in 1974-75, required the district to bus students across neighborhoods to reduce the number of racially imbalanced Boston schools. As a result, by 1980, the percentage of schools representative of the district as a whole nearly tripled to 41 percent (62 schools). By then, while two thirds of all students (65 percent) were students of color, the number of schools with very small or very large concentrations of them had declined dramatically.
In 1989, Boston Public Schools adopted a new Controlled School Choice assignment system that divided the city into three zones, assigned greater weight to family preferences, and sought to create schools with racial compositions more closely resembling those of their zones. In 2001, the Boston School Committee eliminated schools’ racial makeup as a consideration for assignment, and in 2014, replaced the entire assignment system with the current Home Based Assignment Plan (HBAP). Under HBAP—which seeks to provide students with “greater access to quality schools closer to home”30—each family receives a “choice basket” of at least six schools generated by the district based on distance from home, school capacity and school quality.iv
Concurrent with these policy changes, two demographic trends continued. As Table 1 shows, the percentage of students of color in the system continued to increase: By 2019, nearly nine out of 10 students were students of color (87 percent). At the same time, the number and percentage of schools whose students are representative of the system held steady. In 2000, more than half of all schools were representative of the system’s share of students of color. By 2019, this share was unchanged, at 53 percent of all schools (74 schools).
Given the rising share of students of color in Boston overall, continuing residential segregation and the prioritization in school assignment of proximity to the student’s home, it perhaps comes as little surprise that the number of schools enrolling very high percentages of students of color has increased so significantly over the past decades and that many more of them have become representative of the district. As the sector itself now enrolls very high shares of students of color, this trend has also meant that more and more schools are representative of a system that itself has become less integrated.
As we noted earlier, the constructs of diversity, integration, and representativeness are complex and may sometimes even be at odds. As a result, in this report, the analyses of concentration and of representativeness together can be informative in capturing and understanding important nuances. For example, a school enrolling a very high percentage of students of color can be representative of a district whose student body itself is largely non-white—but that same school may not necessarily be integrating students of diverse backgrounds. For example, the Donald McKay K–8 School (92 percent students of color) is considered representative—that is, within 10 percentage points—of Boston’s public schools’ student population overall. And Phineas Bates Elementary School is not: At the Bates, 76 percent of students are of color, just missing the 10 percentage-point lower band around the system-wide average of 87 percent. But a student attending the Bates would in fact experience a far more diverse, integrated school than a student attending the McKay. While nearly 90 percent of students at the McKay are Latino, at the Bates 30 percent of students are Black, 36 percent are Latino, 24 percent are white, and 5 percent are Asian.
ONLY ABOUT A QUARTER OF BOSTON’S SCHOOLS ARE REPRESENTATIVE WHEN FOCUSING ON COMBINED BLACK AND LATINO ENROLLMENT.
Grouping all students of color in a single category is one approach to analyzing school integration, but it may miss important nuances across groups. In particular, many researchers prefer to look at a smaller cluster that just combines Black and Latino students, as these two racial groups tend to share a higher degree of disadvantage than Asian or white students (Native American students do too, but very few Native American students attend Boston schools).v In Boston, Black and Latino students tend to come from families with lower incomes and tend to have lower academic achievement than Asian and white students. At the same time, it’s important to stress that there is tremendous diversity within all racial groups and many Asian and white students also face very real disadvantages. In order to see whether the story changes at all, here we conduct the same representativeness analyses but for Black and Latino students together and for white and Asian students together. This approach uncovers a very different trend.
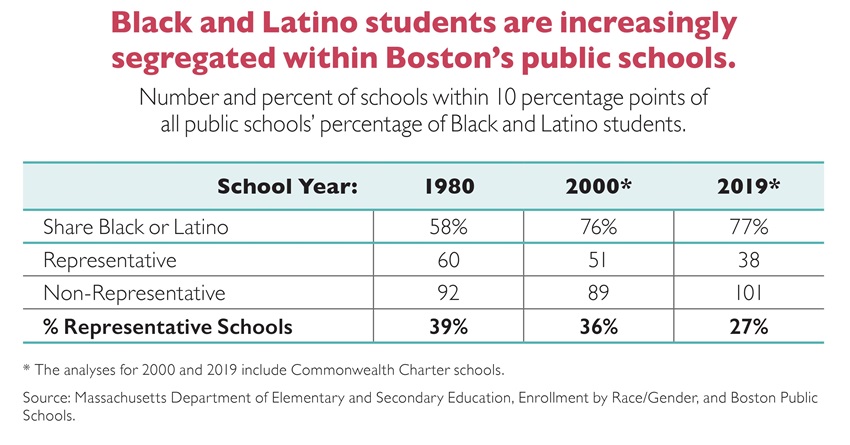
More than three quarters (77 percent) of Boston students are Black or Latino, and these two groups account for the vast majority of students of color. Their combined share of student enrollment has increased consistently, up from 58 percent in 1980. And yet, over the same time frame, fewer schools in Boston have come to reflectthis share (see Table 2). As Black and Latino students frequently attend schools in which the majority of students are of their own race, in 2019, only 38 of all 139 public schools—27 percent—in Boston were representative of the sector’s overall percentage of Black or Latino students. And both the number and percentage of representative schools has been on the decline: In 1980, 60 schools were representative, accounting for nearly four out of 10 schools.
The fact that so many fewer schools are representative of the sector’s enrollment of Black and Latino students (in Table 2) compared to all students of color (in Table 1) appears to be driven, at least in part, by underlying enrollment trends in which white and Asian students are ending up together in many of the same schools, while Black and Latino students are becoming more isolated from other groups. For example, in 30 schools, the combined share of white and Asian students is so high that it falls outside the representative band of their respective share of 20 percent across all public schools. At the same time, almost half of all schools—68 schools—have such high concentrations of Black and Latino students that these schools also fall outside the upper end of the representative band around the system average of 77 percent Black and Latino students. Finally, because of a sufficiently large enrollment of Asian students,nine schools are representative of all public schools’ percentage of students of color but have a share of Black and Latino students that falls below the representative band of the system-wide average for the latter.
AS WITH RACE AND ETHNICITY, MORE THAN HALF OF INDIVIDUAL SCHOOLS IN BOSTON ARE REPRESENTATIVE OF THE STUDENT POPULATION ACROSS ALL PUBLIC SCHOOLS IN TERMS OF FAMILY INCOME.
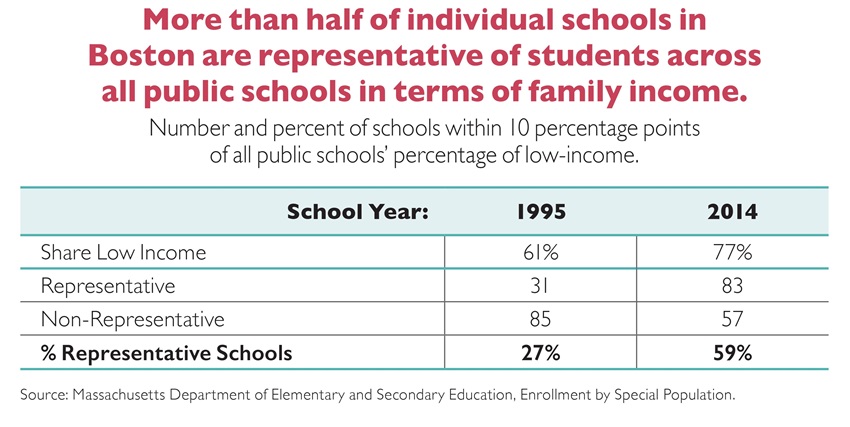
Analyzing the extent to which individual schools are representative of Boston’s public schools as a whole in terms of family income yields similar findings to the analyses of representativeness for all students of color. Table 3 shows the number and percentage of individual schools that are representative of the share of low-income students in Boston’s public schools overall. As discussed in Section 2, these analyses begin in 1995, the earliest year for which data are complete, and end in 2014, the last year in which students’ low-income status was defined in the same way.
Since 1995, a growing share of individual schools in Boston have become representative of the public school sector in terms of its percentage of students who come from low-income families. In 1995, 31 schools—27 percent of all schools—were representative of the system’s share of low-income students, which was 61 percent. By 2014, the percentage of representative schools had more than doubled. That year, 83 schools in Boston were representative; this means that still fewer than two thirds (59 percent) of Boston schools were representative of public schools across the city as a whole.This finding is consistent with the fact that by 2014 the share of Boston’s public schools students from low-income families had increased to more than three quarters of students (77 percent) and that these students are concentrating in vast majorities in a rising number of schools.
REFLECTING A GROWING MISMATCH, VERY FEW PUBLIC SCHOOLS IN BOSTON ARE REPRESENTATIVE OF THE CITY AS A WHOLE—IN TERMS OF RACE OR FAMILY INCOME.
While about half of Boston’s schools are representative of the public-school student population in terms of race or family income, our schools are far less representative of the city as a whole. Though sobering, this is not surprising in light of the growing demographic and socioeconomic mismatch between the city and its students discussed at length earlier in the report. With young people in Boston more likely to be of color, large numbers of families with school-aged children leaving the city, and more households without children moving in (see Section 2), Boston’s public school students look very different from the city’s population overall. In 2019, out of 139 schools, only 10 schools were representative of Boston’s share of residents who are people of color. And dramatically few schools—only four—were representative of the city in terms of its share of low-income residents. Such dramatic divergence raises serious questions about the extent to which interests and priorities of families with school-aged children in Boston are reflected appropriately in decision-making systems and processes in the city—and ultimately, about what this means for the future of the city.
i. The data for school year 1967 grouped together all students of color and did not disaggregate individual race and ethnicity groups. As a result, analyses of enrollment for all students of color in this section include school year 1967, while analyses of individual races and ethnicities begin in school year 1980.
ii. The school in which 96 percent of students were Latino is the Margarita Muñiz Academy, Boston’s first dual language high school.
iii. The three schools are the Rafael Hernandez K-8 School in Roxbury, the Sarah Greenwood K-8 School in Dorchester, and the Margarita Muñiz Academy, Boston’s first dual-language high school, located in Jamaica Plain.
iv. Previously measured by MCAS Tier, school quality is now designated according to Boston Public Schools’ School Quality Framework.
v. For instance, a September 2019 Washington Post feature report, The Changing Face of School Integration, and the Civil Rights Project at UCLA’s 2013 report, Losing Ground: School Segregation in Massachusetts, both focus their school segregation analyses on the experience of Black and Latino students.
APPENDIX
Some Boston neighborhoods have seen large school-aged population declines, while many suburbs west of Boston experienced big gains.
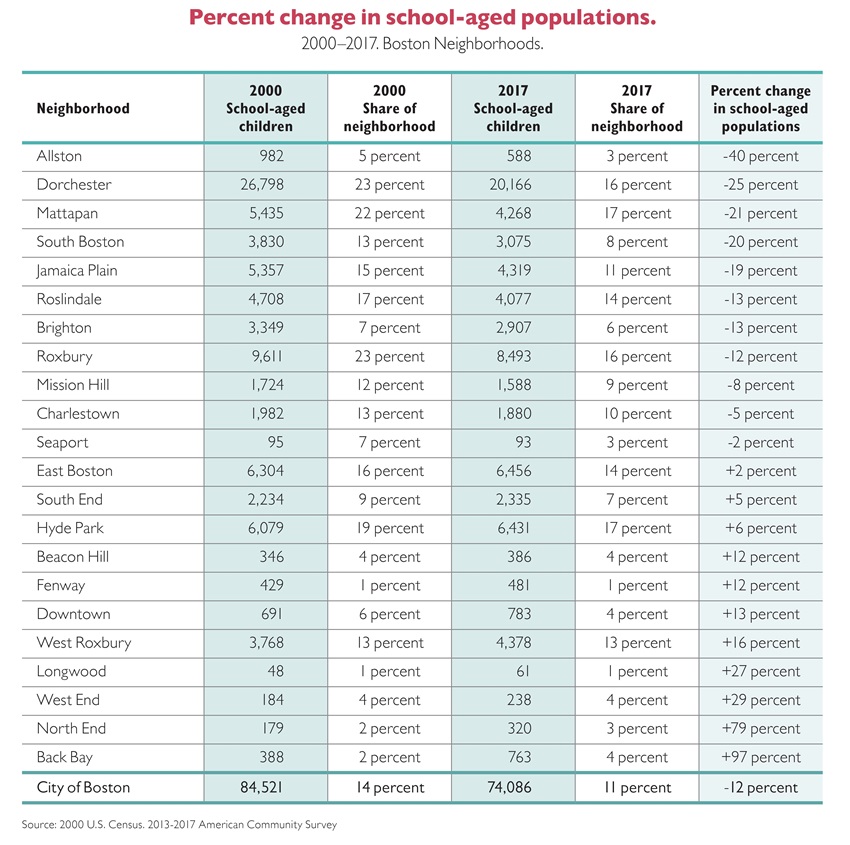
To see how these school-aged population declines vary across geography, we’ve analyzed change both for Boston neighborhoods and across Greater Boston as a whole. For these geographic analyses, we focus in on the most recent phase of decline, from 2000 to 2017.
Note: Due to small sample sizes from the Census Bureau’s American Community Survey, the data that we’re labeling as “2017” here is actually from pooled estimates that cover five-years from 2013 to 2017, meaning that these declines—like the 25 percent decline in Dorchester described below—occurred over a very short time period of only roughly 15 years.
BOSTON NEIGHBORHOODS
Of Boston’s larger neighborhoods, Dorchester experienced the sharpest decline, losing around 6,600 school-aged kids between 2000 and 2017 (a 25 percent drop).
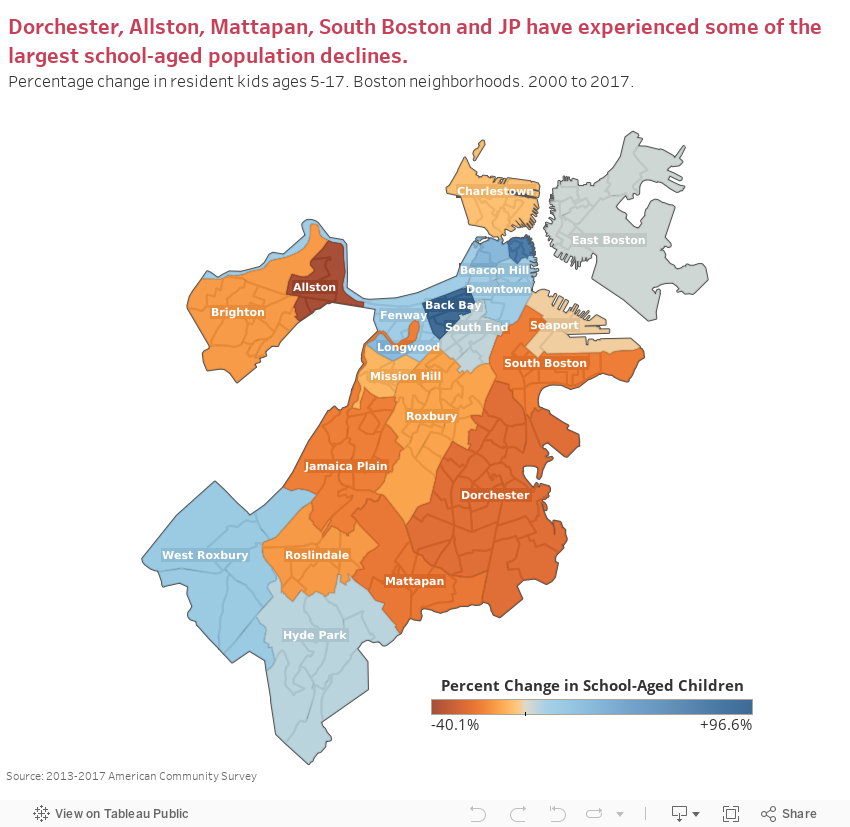
Allston—a much smaller neighborhood with fewer than 1,000 school-aged kids in 2000—experienced the largest percentage decline (40 percent). Mattapan, South Boston and Jamaica Plain are all larger Boston neighborhoods that also experienced school-aged population declines of around 20 percent.
West Roxbury is the one residential neighborhood with a notable increase in school-aged kids—up 16 percent since 2000. Even this increase came in the context of a neighborhood that was growing overall. Of the 11 neighborhoods that did see gains in school-aged kids, only four had growth that kept pace with growth of other age groups as well (Back Bay, North End, Fenway and Beacon Hill).
GREATER BOSTON
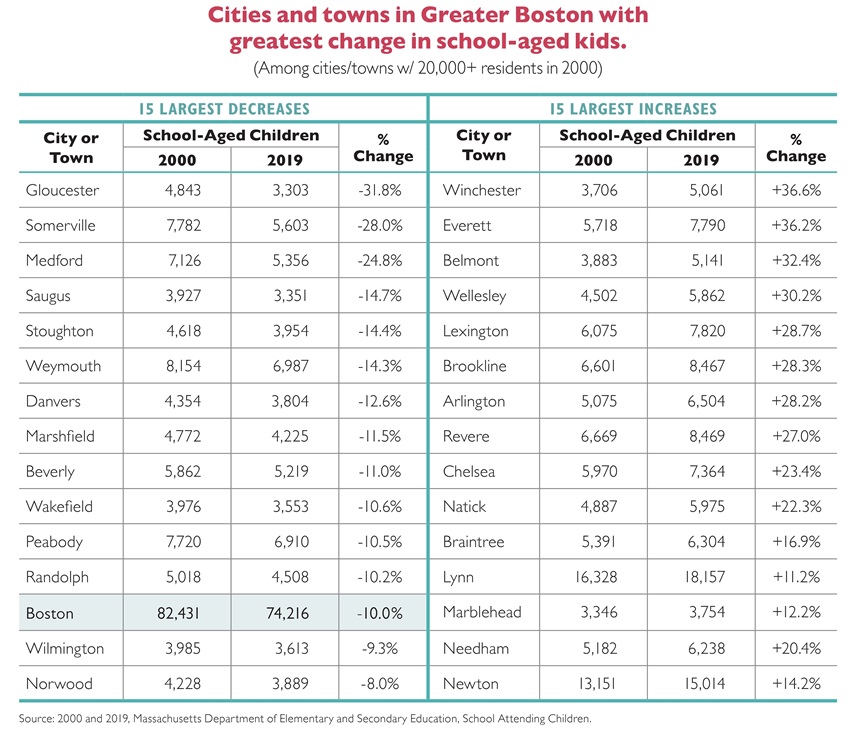
In aggregate the Greater Boston region saw a modest 1.5 percent increase in the number of school-aged kids since 2000, but there’s significant variation by municipality. As Boston lost school-aged kids, many suburbs saw complementary increases (see the map, below). Suburbs to the west of Boston, many of which are higher income, have seen some of the region’s largest gains. Towns like Winchester, Belmont and Sudbury each saw school-aged population increases of more than 30 percent. Some of these families come from Boston itself, moving out to the suburbs once their kids become school-aged, while many others move to Boston’s suburbs from elsewhere in the U.S. Still others come from abroad, and instead of settling in Boston, move to other places in the region seeking things like lower housing costs and local community ties to their countries of origin.31 Whether or not such assessments are fair, the perception that K–12 schools are “better” in the region’s higher-income suburbs is probably another driving factor behind some of these geographic moves.
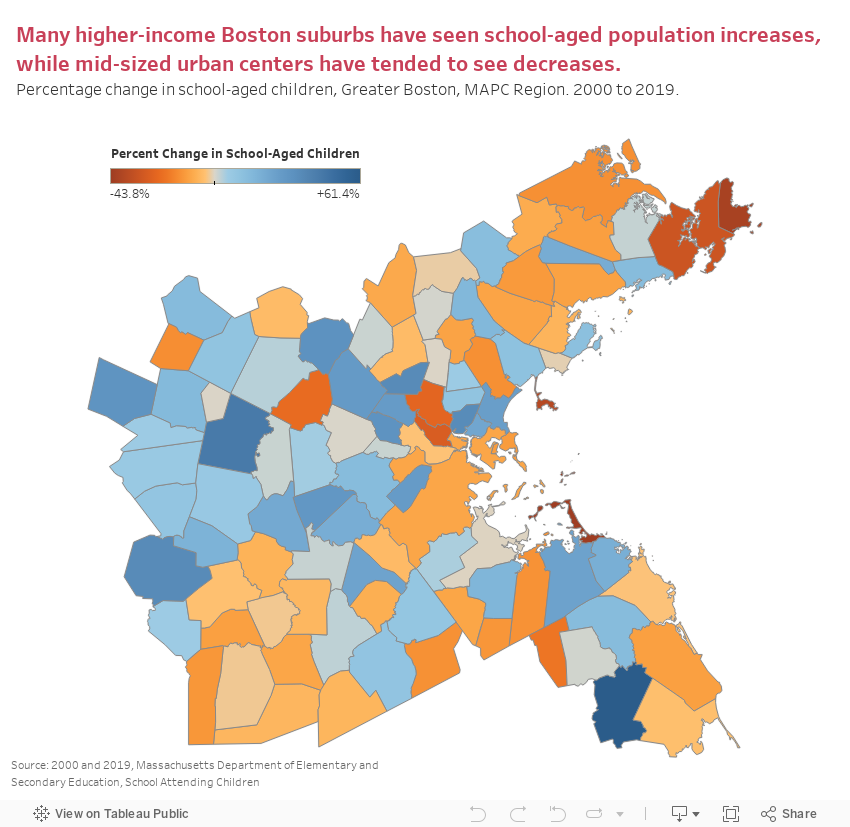
Note: For this regional analysis we use a different source of data for estimating the number of school-aged kids. Most of the population data in Parts 1 and 2 of this report use American Community Survey estimates for Boston, allowing us to do more fine-grained analyses by age, income and race. But ACS estimates are especially rough for smaller cities and towns outside of Boston, so here we instead use administrative data on K–12 school enrollment by place of residence from the Department of Elementary and Secondary Education (DESE). This data adds up enrollment for kids attending district public schools, regional schools, charter schools and all types of private schools.
Map A-2 shows the percent change in school-aged children for every municipality in the Greater Boston region. Smaller, mid-sized cities, particularly those on the North Shore, have seen the largest declines in school-aged population. Gloucester alone lost over 30 percent of its school-aged population since 2000. Beverly and Peabody each saw declines of 11 percent.
When we focus on Boston and its immediate neighbors, some interesting patterns also emerge. Using the Mystic River as a dividing line, every city north of the river and bordering Boston saw school-aged population gains. Collectively, Chelsea, Everett and Revere increased their school-aged population by 29 percent, or more than 5,000 students. Just south of the Mystic, though, Boston, Somerville and Cambridge all saw significant losses of school-aged populations.
While outside of this report’s focus on Greater Boston, it’s worth noting that largeportions of central and western Massachusetts have also lost school-aged kids. Deindustrialization led to job loss and economic stagnation in and around some of the state’s mid-sized cities. Overall population growth has been somewhat level in these areas, but the population mix has gotten significantly older and there are now far fewer families with children. For instance, a recent analysis from Commonwealth magazine found an alarming “decline of the under-18 population (in Hampshire County) since 2000… Comparing census data between 2000 and 2010, we found that despite a 3 percent increase in population for Hampshire County, its under-18 population declined by 10.5 percent. These trends are consistent among the other three Western Massachusetts counties.”32
METHODOLOGY
Methodological Note 1
This report’s income analyses define “middle-income” as households earning between 100 and 200 percent of median household income in Boston (roughly between $61,300 and $122,600 in 2017). We use 100 percent of median income in Boston since it is roughly equivalent to 60 percent of area median income (or “AMI”) for a household of three (incomes are higher across the Boston area than they are in Boston proper). Subsidized housing programs tend to use the Department of Housing and Urban Development’s AMI calculations as the measure for calculating income eligibility, with the vast majority of subsidized housing units going to households earning at 60 percent of AMI or lower (for instance, 87 percent of Boston’s income-restricted housing units are occupied by households earning below 60 percent of AMI). We go up to the 200 percent of city median income threshold in order to capture a meaningful share of the total population within our middle-income bucket. We also ran these analyses by defining “middle-income” more narrowly—using 80 to 120 percent of city median income, and the broad story remains the same: Boston has experienced a decline in middle-income families with children across a range of different middle-income definitions.
Methodological Note 2
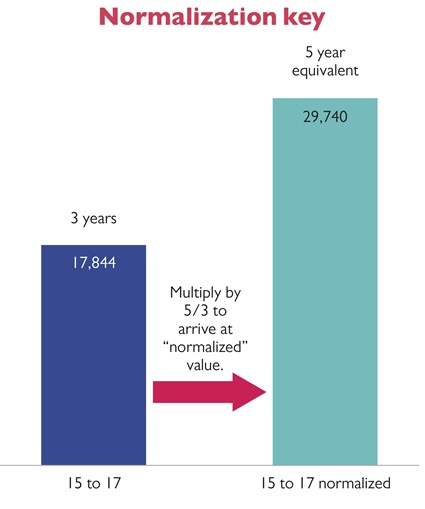
These analyses look at the most recent Census data available for disaggregating by age,race and income and they are based on Census-defined categories for grouping kids of similar ages. The first three groupings each capture equivalent five-year bands—kids who are ages 0, 1, 2, 3 and 4 are in one grouping; kids who are 5, 6, 7, 8 and 9are in the second grouping; and kids who are 10, 11, 12, 13 and 14 are in the third. Unfortunately for our purposes, the next Census-defined grouping of school-aged kids captures only three distinct years rather than five—ages 15, 16 and 17. The Census does this to avoid combining kids still in high school with young adults who have started college. This means we can’t simply compare the number of kids in this final grouping to those in the earlier five-year groupings. In order to facilitate rough comparisons with the earlier groupings, we normalize the estimates in this 15- to 17-year-oldgrouping by multiplying the population numbers by 5/3, as in Figure A-1. This rough estimating approach allows us to present population totals for the 15- to 17-year-old grouping as if it covered five-years instead of just three.
In addition to the measurement difficulties identified above, it’s important to emphasize that the numbers we present here are very rough estimates. In order to get a large enough sample of data, the data we use are based off of pooled data from American Community Survey questionnaires administered during the years 2013 through 2017. Even with this five-year sample, the estimates here are far from precise; very few households were surveyed with, say, Latino kids between the ages of five and nine who are also high-income, so it is hard to extrapolate from this sample a precise estimate for the number of such kids living in Boston today. The broad magnitude and direction of trends presented in these graphs are indicative of real dynamics on the ground in Boston, but precise numbers should not be drawn from these graphs.
Methodological Note 3
Our analyses of student family incomes focuses on SY1995 to SY2014 because this is the most recent timeframe for which we have consistent data on income. Specifically, during these years, students were counted as low-income if they qualified for free or reduced-price meals through the federal school lunch program. The cutoff for eligibility was 185 percent of the federal poverty line. Starting in SY2014, first Boston—and later other districts in Massachusetts—began participating in the Community Eligibility Program (CEP), a new school lunch program option for schools and districts with high concentrations of low-income students, through which all students in participating schools receive free meals. While participation in CEP eliminated the cost and administrative burden of collecting information every year on family incomes, it also meant that data on students’ eligibility for free and reduced price lunch was no longer consistently collected across the Commonwealth. As a result, the Department of Elementary and Secondary Education developed a new income status metric called “Economically Disadvantaged,” based on “direct certification” of students’ participation in one or more public benefit programs, such as the Supplemental Nutrition Assistance Program or Mass Health. This switch from free or reduced-price lunch eligibility to direct certification for defining income status meant that the data on low-income students prior to SY2015 is no longer comparable to the newly reported metric of economically disadvantaged students.
ENDNOTES
- Livingston, G. Is U.S Fertility at an All-Time Low? Two of Three Measures Point to Yes, Pew Research Center, May 2019.
- Family Housing Affordability in U.S. Cities, Governing, November 2015.
- Stone, L. Higher Rent, Fewer Babies? Housing Costs and Fertility Decline, Institute for Family Studies, October 2018.
- DiCara, L., Malo, V. Where have all the children gone? Commonwealth Magazine, September 2017.
- The Productivity-Pay Gap, Economic Policy Institute, July 2019.
- Berube, A. City and Metropolitan Income Inequality Data Reveal Ups and Downs through 2016, Brookings, February 2018.
- Zillow Rent Index, Zillow Research Center.
- 2019 Home Affordability Report, Unison, June 2019.
- Changing Faces of Greater Boston, Boston Indicators and University of Massachusetts (UMass Boston and UMass Donahue Institute), May 2019.
- Income-Restricted Housing in Boston, City of Boston Department of Neighborhood Development, November 2018.
- O'Keefe, B. Steel King, M. Aldeman, C. An Uneven Path: Student Achievement in Boston Public Schools, Bellweather Education Partners and the Boston Foundation, February 2019.
- Wages by Education, Economic Policy Institute’s State of Working America Data Library.
- Holme, JJ. Buying homes, buying schools: School choice and the social construction of school quality. Harvard Educational Review, July 2002.
- Saporito, S., Lareau, A. School Selection as a Process: The Multiple Dimensions of Race in Framing Educational Choice, Social Problems, August 1999.
- Glinski, J. The Catholic Church and the Desegregation of Boston’s Public Schools, New England Journal of Public Policy, June 1988.
- METCO Annual Report, 2018–2019, The Metropolitan Council for Educational Opportunity, 2019.
- Mickelson, R.A. School Integration and K–12 Outcomes: An Updated Quick Synthesis of the Social Science Evidence, National Coalition on School Diversity, October 2016; Ayscue, J., Frankenberg, E., Siegel-Hawley, G. The Complementary Benefits of Racial and Socioeconomic Diversity in Schools, National Coalition on School Diversity, March 2017.
- Ibid.
- Stuart Wells, A., Fox, L., Cordova-Cobo, D. How Racially Diverse Schools and Classrooms Can Benefit All Students, The Century Foundation, February 2016.
- Palardy, G.J. Differential school effects among low, middle, and high social class composition schools, School Effectiveness and School Improvement, May 2008.
- Tegeler, P., Mickelson, R.A., Bottia, M. What We Know about School Integration, College Attendance, and the Reduction of Poverty, National Coalition on School Diversity, March 2011.
- Palardy, G.J., High school socioeconomic segregation and student attainment, American Educational Research Journal, August 2013.
- Johnson, R.C. Children of the Dream: Why School Integration Works. Basic Books and Russell Sage Foundation Press, April 2019; Mickelson, R.A. School Integration and K–12 Outcomes: An Updated Quick Synthesis of the Social Science Evidence, National Coalition on School Diversity, October 2016; Ayscue, J., Frankenberg, E., Siegel-Hawley, G. The Complementary Benefits of Racial and Socioeconomic Diversity in Schools, National Coalition on School Diversity, March 2017.
- Siegel-Hawley, G. How Non-Minority Students Also Benefit from Racially Diverse Schools, National Coalition on School Diversity, October 2012; Pettifrew, T.F., Tropp, L.R. A Meta-analytic Test of Intergroup Contact Theory, Journal of Personality and Social Psychology, 2006.
- Crosnoe, R. Low-Income Students and the Socioeconomic Composition of Public High Schools, American Sociological Review, October 2009.
- Ibid.
- Stuart Wells, A., Fox, L., Cordova-Cobo, D. How Racially Diverse Schools and Classrooms Can Benefit All Students, The Century Foundation, February 2016; Siegel-Hawley, G. How Non-Minority Students Also Benefit from Racially Diverse Schools, National Coalition on School Diversity, October 2012
- Siegel-Hawley, G. How Non-Minority Students Also Benefit from Racially Diverse Schools, National Coalition on School Diversity, October 2012; Mickelson, R.A. School Integration and K–12 Outcomes: An Updated Quick Synthesis of the Social Science Evidence, National Coalition on School Diversity, October 2016.
- Neighborhood Profiles, Boston Planning & Development Agency Research Division, August 2017.
- Update on Home Based Assignment System, Boston Public Schools, October 2014.
- Changing Faces of Greater Boston, Boston Indicators and University of Massachusetts (UMass Boston and UMass Donahue Institute), May 2019.
- DiCara, L., Malo, V. Where have all the children gone? Commonwealth Magazine, September 2017.