

Massachusetts is the second “gayest” state in the country. According to the Gallup Daily Tracking Survey, 5 percent of Massachusetts’ total population identifies as lesbian, gay, bisexual or transgender (LGBT), second only to Vermont (5.8 percent).23
It is, however, likely that 5 percent is a low estimate for the share of Massachusetts’ total population that identifies as LGBT. While we need to rely on national surveys for 50-state comparisons like the one above, our state Department of Public Health actually estimates that about 7.2 percent of Massachusetts adults report being LGBT. On the 2016 Behavioral Risk Factor Surveillance System survey, 6.8 percent of adults reported being gay, lesbian, bisexual or “something else”i and 0.4 percent reported being transgender.24 This means that of 5,474,136 adults in Massachusetts in 2016,25 approximately 394,000 are LGBT.

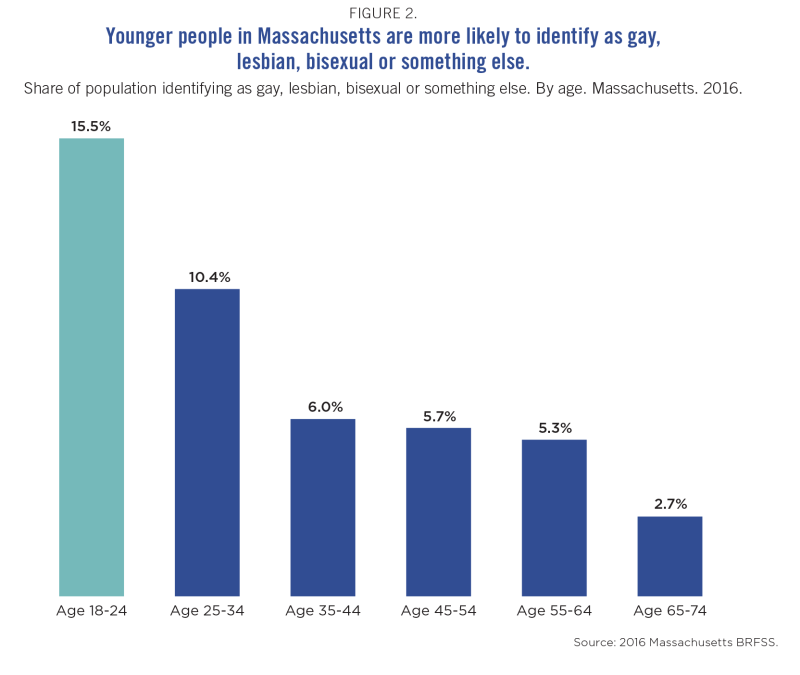
Further, even the higher Department of Public Health figures likely underestimate the true size of our LGBT population. Given today’s more welcoming environment and relatively high rate of LGBT identification among 18- to 24-year-olds, it is reasonable to think that the LGBT population may, in reality, account for a greater percentage of Massachusetts’ total population than 7.2%.
Almost 16 percent of Massachusetts residents between the ages of 18 and 24 identify as gay, lesbian, bisexual or something else, while less than 3 percent of those aged 65 to 74 identify as such. Young people also identify as transgender more often than does the general population. In 2015, 2.0 percent of Massachusetts high school students identified as transgender,26 a figure more than five times as high as the 0.34 percent of the adult population that identified as transgender in 2015.27
The relationship between LGBT identification and age can be partially explained by the safer and more supportive environment experienced by today’s young LGBT population as compared to that of prior generations. Many LGBT elders came of age in a time when homosexuality was broadly considered a sin, a crime, and a mental disorder.28 As a result of the discriminatory treatment they routinely experienced, many LGBT elders report higher degrees of internalized stigma and identity concealment.29 While there is much work yet to be done in creating a truly inclusive environment, much progress has been achieved: 92 percent of American LGBT adults say that society has become more accepting of them in the past decade.30
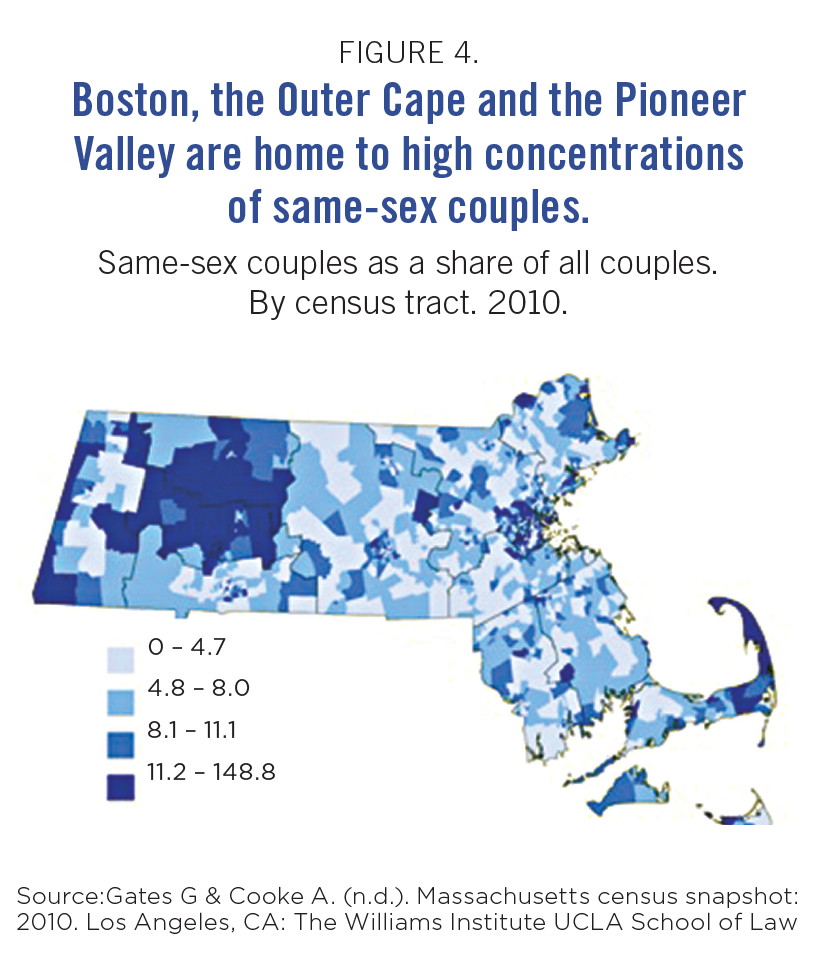
Massachusetts' LGBT population lives throughout the state, with concentrations in Boston, the Pioneer Valley, and the Outer Cape
While Boston is home to the largest number of LGBT people in the state, other regions of the state also have significant numbers of LGBT populations. Suffolk, Hampshire and Franklin Counties have the highest percentages of LGBT people as a share of their total county population, at 7.5 percent of the population or higher.
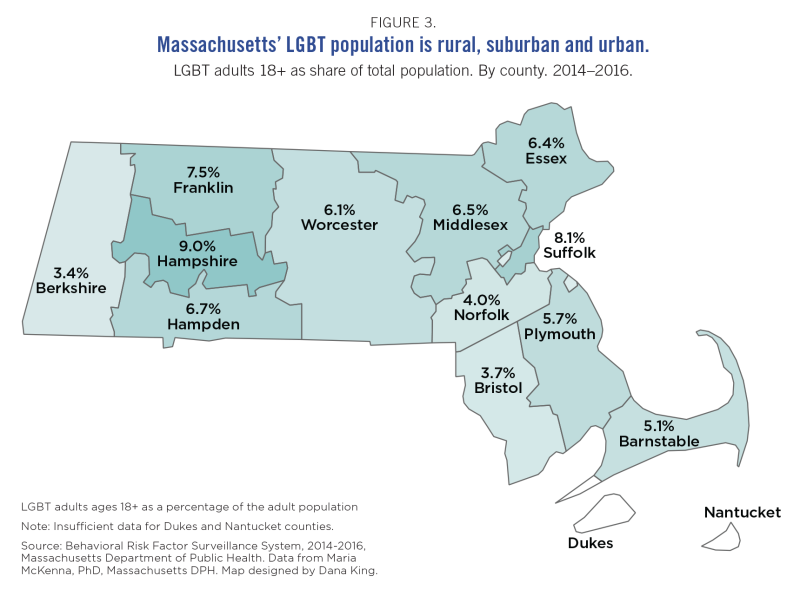
Nine of Massachusetts’ 14 counties have LGBT populations that account for at least 5 percent of their total populations. (There were insufficient data from Martha’s Vineyard and Nantucket to be able to characterize what percentage of the population of those islands is LGBT.)31 Owing to data limitations,ii a more granular analysis of the LGBT population’s geography is limited to same-sex couples.iii In 2010, there were at least 11 same- sex couple households for every 1,000 households in the Pioneer Valley, the Berkshires and the Outer Cape. Lesbian couples were most concentrated in Franklin, Hampshire, Middlesex and Barnstable counties, while gay male couples were most concentrated in Suffolk County, the Cape and Islands.32
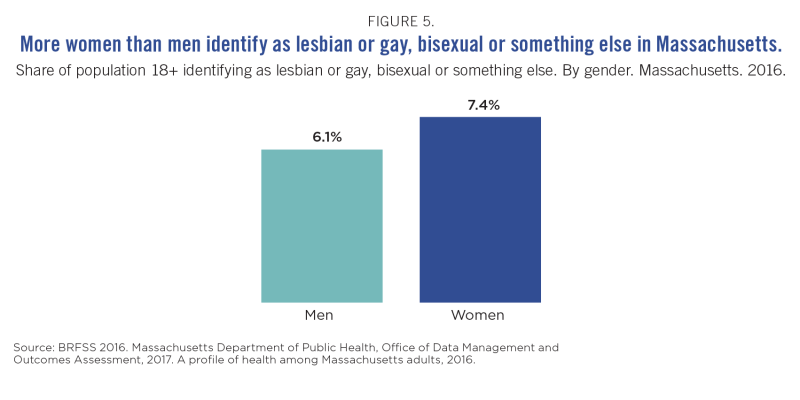
More women than men identify as lesbian or gay, bisexual or something else.
In Massachusetts, women are more likely than men to identify as “lesbian or gay,” “bisexual,” (LGB) or “something else.” Some 7.4 percent of adult women identify as LGB or something else, while 6.1 percent of adult men identify as such.33 (On the Massachusetts Behavioral Risk Factor Surveillance System survey, women are asked if they are “lesbian or gay,” whereas men are asked if they are “gay.”)34 Among same-sex couple households, the same trend holds true: 57.1 percent of same-sex couples were female, or lesbian couples, while 42.9 percent of same-sex couples were male or gay male couples.35 (Many individuals in these couples would identify as bisexual, queer, or something other than gay or lesbian.)
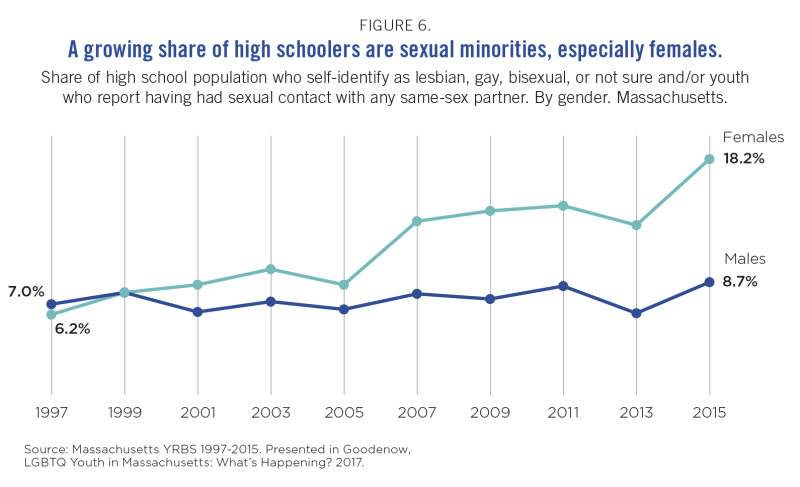
An even more striking difference in sexual orientation exists between female and male high school students in Massachusetts. In 2015, 13.0 percent of all high school youth were sexual minorities.iv In other words, they reported identifying as lesbian, gay, bisexual, or not sure, or they reported same-sex behavior. Among female youth, 18.2 percent were sexual minorities. Among male youth, only 8.7 percent were sexual minorities.v
From 1997 to 2015, the percentage of high school aged females and males who identified as LGB or reported same-sex behavior increased. The growth in the percentage of high school aged females who are sexual minorities is particularly striking—from 1997 to 2015, it more than doubled from 7 percent to 18.2 percent.36
The race and ethnicity of our LGBT population mirrors that of the state overall.
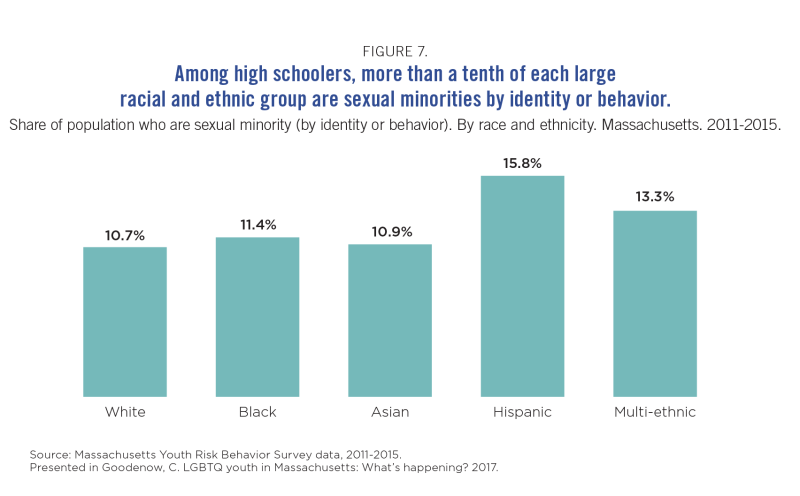
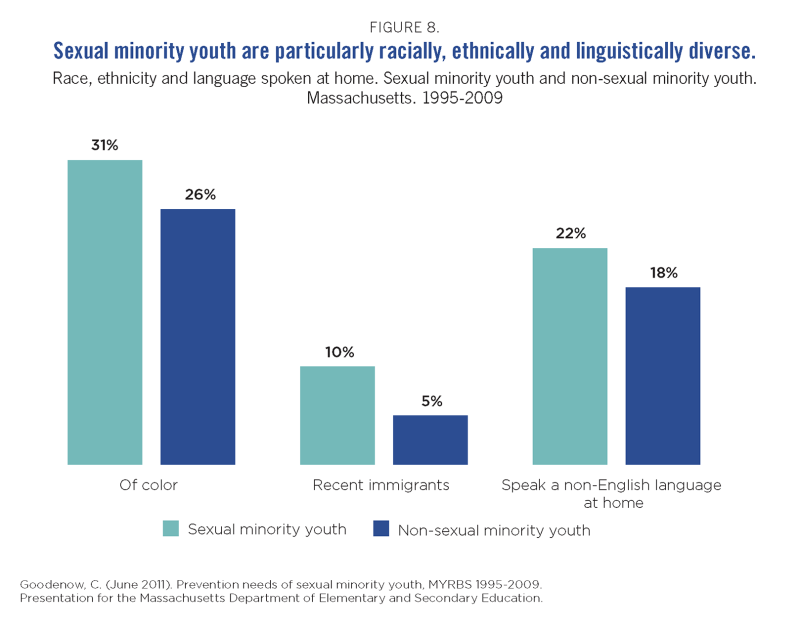
Among high school youth, more than 10 percent of each large racial and ethnic group are sexual minority. Of youth who identify as Hispanic, almost 16 percent belong to sexual minority groups, the highest share among large racial and ethnic groups of youth. Massachusetts has become more racially and ethnically diverse over the past several decades, mirroring a national demographic shift. That diversity is particularly striking at the intersection of sexual minority status and race, ethnicity and language spoken among youth. According to an analysis of pooled YRBS data from 1995 to 2009, sexual minority youth are more likely than their peers to be people of color (31 percent vs. 26 percent), recent immigrants (10 percent vs. 5 percent) or speak a non-English language at home (22 percent vs. 18 percent).37 These intersections highlight the importance of carefully considering the needs of the LGBT population when serving groups characterized by racial, ethnic, national origin or linguistic similarities.
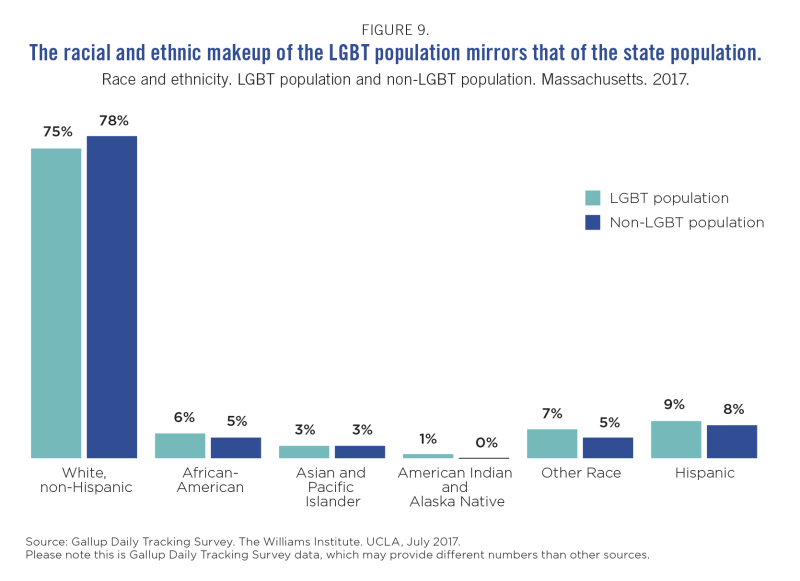
Overall, the racial and ethnic makeup of those who report being LGBT on the Gallup Daily Tracking Survey for Massachusetts is similar to that of the state as a whole. Like Massachusetts’ general population, three- quarters of the LGBT population is white. Almost one in ten report being Hispanic, about one in twenty report being black, and almost one in thirty report being Asian.
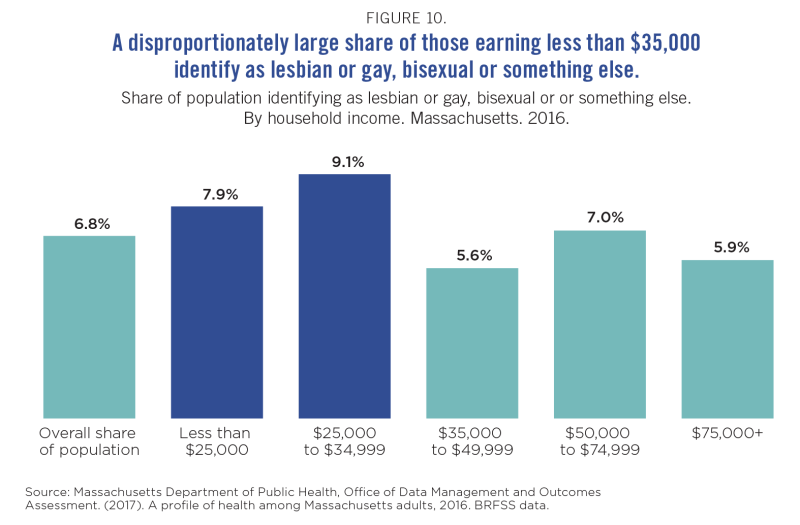
While same-sex couples out-earn different-sex couples on average, LGBT people make up a disproportionately large share of people at the bottom of the income ladder.
A disproportionately large share of Massachusetts’ residents earning less than $35,000 identify as lesbian or gay, bisexual (LGB) or something else. Overall, 6.8 percent of our state population age 18 or older identifies as LGB or something else. More than 9 percent of people earning between $25,000 and $34,999, and almost 8 percent of those earning less than $25,000, identify as LGB or something else. In comparison, only 5.9 percent of those earning above $75,000 identify as LGB or something else.38
The skewed income distribution is likely a factor of age, with LGB residents of Massachusetts slightly more likely than heterosexuals to be young. But it could also reflect higher rates of poverty in the LGB community, which we see in national data. Some 24 percent of lesbian and bisexual women live in poverty, compared to 19 percent of heterosexual women.39 About 13 percent of gay and bisexual men live in poverty, the same share as seen in heterosexual men.40
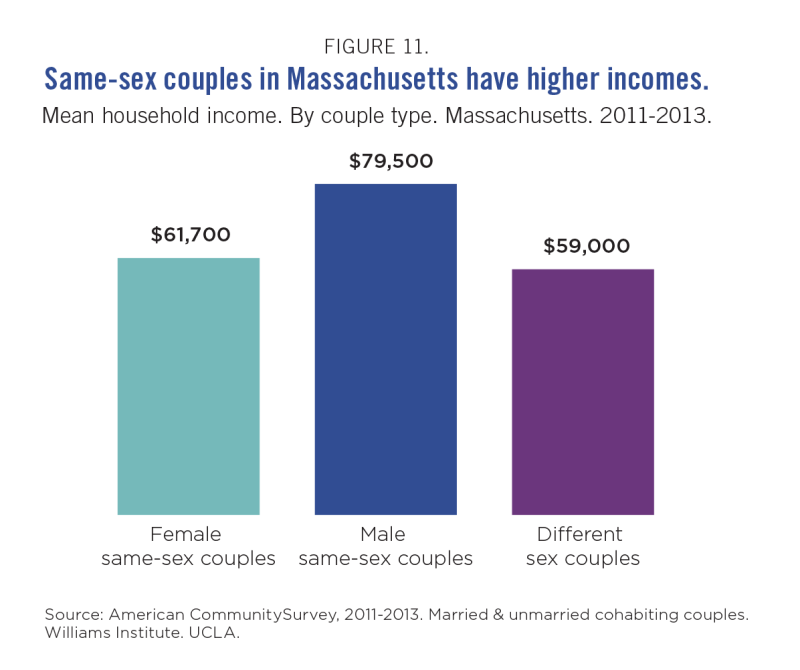
It is, however, noteworthy that both male and female same-sex couples have an average income higher than different-sex couples, who earn an average of $59,000 per year.vi (Please note that same-sex couples are not representative of the entire LGBT population.vii)
Male same-sex couples in Massachusetts have an average income that is approximately 29 percent higher than female same-sex couples—$79,500 versus $61,700, respectively. Still, female same-sex couples out-earn different- sex couples.41
Transgender Massachusetts residents experience higher rates of poverty than people who are not transgender (sometimes referred to as cisgender people). In 2015, seven percent of transgender people in Massachusetts were unemployed, and 17 percent were living in poverty. This compares to 4.8 percent of all Massachusetts residents who were unemployed42 in July 2015, and 11.5% who were poor.43 In part because of their economic circumstances, many transgender people struggle with homelessness.
Some 8 percent of transgender people reported homelessness in the past year and 24 percent reported homelessness at some point in their lives.44
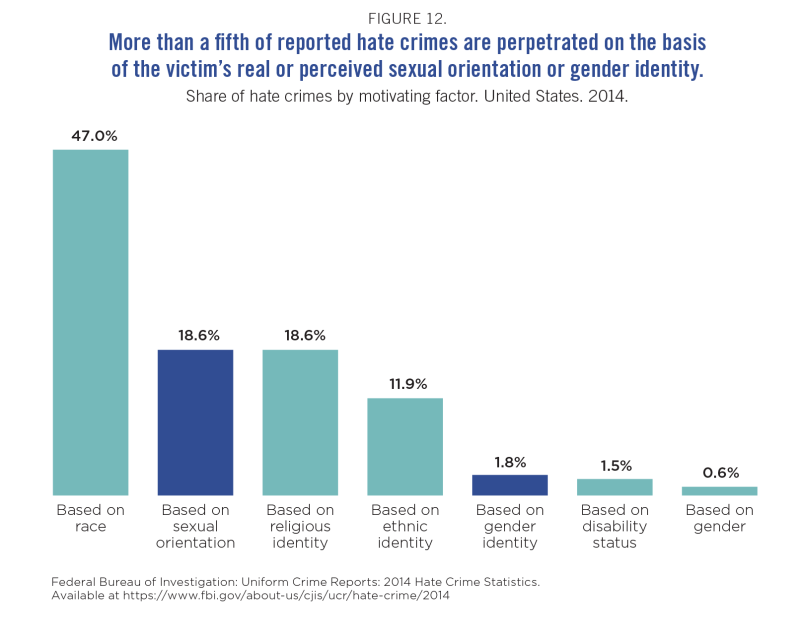
LGBT people are more likely to be targets of hate crime than any other group in America.
In extreme and far too common cases of discrimination, LGBT people—especially black gay and bisexual men and transgender women—experience bias-motivated hate violence.45 On a per capita basis, LGBT people are more likely to be targets of hate crimes than any other group in America.46 In 2014, 18.6 percent of reported hate crimes were perpetrated on the basis of the victim’s sexual orientation, and 1.8 percent were perpetrated on the basis of the victim’s gender identity.47 Combined, this is 20.4 percent, more than a fifth of reported hate crimes. Just as troublingly, research suggests that anti-LGBT hate crimes are more violent and result in hospitalization more often than those based on race/ethnicity, religion or disability.48
Go to Areas for Action
i. "Something else" does not include the response, "straight, that is not gay."
ii. Please note that this data on same-sex couples is drawn from the American Community Survey (ACS). The ACS does not ask direct questions on sexual orientation. It does report on whether two adults in a household are spouses, and the sex of the two individuals who comprise that couple. This data is both useful and limited
iii. In 2016, approximately 394,00 people in Massachusetts were LGBT. The same-sex couple American Community Survey sample for 2016 is 20,256, or approximately 40,512 individuals. This means that about 90% of the LGBT community in Massachusetts is not found in the ACS’ same-sex couple households.
iv. “Sexual minority,” as defined by the Massachusetts Youth Risk Behavior Survey, includes those who self-identify as lesbian, gay, bisexual, or not sure of their sexual orientation, and students who don’t identify as LGB but report having had sexual contact with a same-sex partner.
v. An important distinction exists between the Youth Risk Behavior Survey (YRBS) and the Behavioral Risk Factor Surveillance System (BRFSS). In the YRBS, all high school students are asked about sexual orientation identity and about sexual behavior. In the BRFSS, adults are asked about sexual orientation identity, but only a subset is asked about sexual behavior. For methodological reasons, the Massachusetts BRFSS only reports on what percentage of adults identifies as LGB, while the Massachusetts YRBS reports on both LGB identity and same-sex behavior.
vi. Male same-sex couples are often referred to as gay male couples, even though some members of these couples may not identify as gay. Female same-sex couples are often referred to as lesbian couples, even though some members of these couples may not identify as lesbians. Different sex couples are often referred to as heterosexual or straight couples, even though some members of these couples may not identify as heterosexual or straight. Many individuals in both same-sex and different-sex couples identify as bisexual.
vii. As previously noted, in 2016 approximately 394,00 people in Massachusetts were LGBT. The same-sex couple American Community Survey sample for 2016 is 20,256, or approximately 40,512 individuals. This means that about 90% of the LGBT community in Massachusetts is not found in the ACS’ same-sex couple households.